Mastering the Odds Ratio Equation
📋 In this guide
The odds ratio equation is a fundamental concept in statistics, widely used to determine the strength of association between two binary variables. Despite its importance, many students struggle with understanding and applying the odds ratio equation, often because it involves interpreting data in a probabilistic context rather than a straightforward numerical one. In this article, we'll explore the odds ratio equation in depth, helping you grasp its intricacies and learn how to apply it effectively in various situations. By the end, you'll not only understand the odds ratio equation but also feel confident in using it to analyze data.
Students often find the odds ratio equation challenging because it requires a shift from deterministic problem-solving, such as algebra equations or quadratic equations, to probabilistic reasoning. This transition can be daunting, as it involves understanding concepts like probability, odds, and risk. The odds ratio equation is particularly prevalent in fields like healthcare and social sciences, where interpreting data accurately can have significant implications. Therefore, mastering this equation is essential for students aiming to excel in these domains.
Throughout this article, we'll cover the odds ratio equation from its basic definition to real-world applications. We'll provide step-by-step guidance and worked examples to help you understand and apply the equation effectively. Whether you're tackling homework on equations for proportional relationships or exploring more complex topics like solving exponential equations, the insights gained here will be invaluable. So, let's dive into the world of odds ratios and unravel its complexities together.
Step-by-Step: How to Solve Odds Ratio Equation
Step 1: Understanding the Context
To effectively use the odds ratio equation, the first step is to understand the context of the data you are analyzing. Determine the two groups you are comparing and identify the event of interest. For example, if you are studying the effect of a drug, one group might be the treated patients, and the other could be the control group. The event of interest could be the occurrence of a specific side effect. Clearly defining these groups and events is crucial for setting up your data correctly.
Step 2: Setting Up the Contingency Table
Once you've defined the groups and events, organize the data into a 2x2 contingency table. This table helps you visualize the frequency of events and non-events in both groups. Label the rows as the two groups (e.g., smokers and non-smokers) and the columns as the event and non-event (e.g., developed lung cancer and did not develop lung cancer). Fill in the table with the corresponding data, ensuring accuracy to avoid errors in calculations.
Step 3: Calculating the Odds for Each Group
With the contingency table in place, calculate the odds of the event occurring in each group. For the first group, divide the number of occurrences of the event by the number of non-occurrences (a/b). Repeat this process for the second group (c/d). These odds represent the likelihood of the event happening relative to it not happening within each group. A clear understanding of these odds is essential for interpreting the final odds ratio.
Step 4: Computing the Odds Ratio
The final step is to compute the odds ratio using the formula provided earlier. Divide the odds of the event in the first group by the odds in the second group. The resulting value indicates the strength and direction of the association between the groups concerning the event. An odds ratio greater than 1 suggests a higher likelihood of the event in the first group, while a value less than 1 indicates a lower likelihood. Understanding this interpretation is key to applying the odds ratio in practical scenarios.
🤖 Stuck on a math problem?
Take a screenshot and let our AI solve it step-by-step in seconds
⚡ Try MathSolver Free →Worked Examples
Example 1
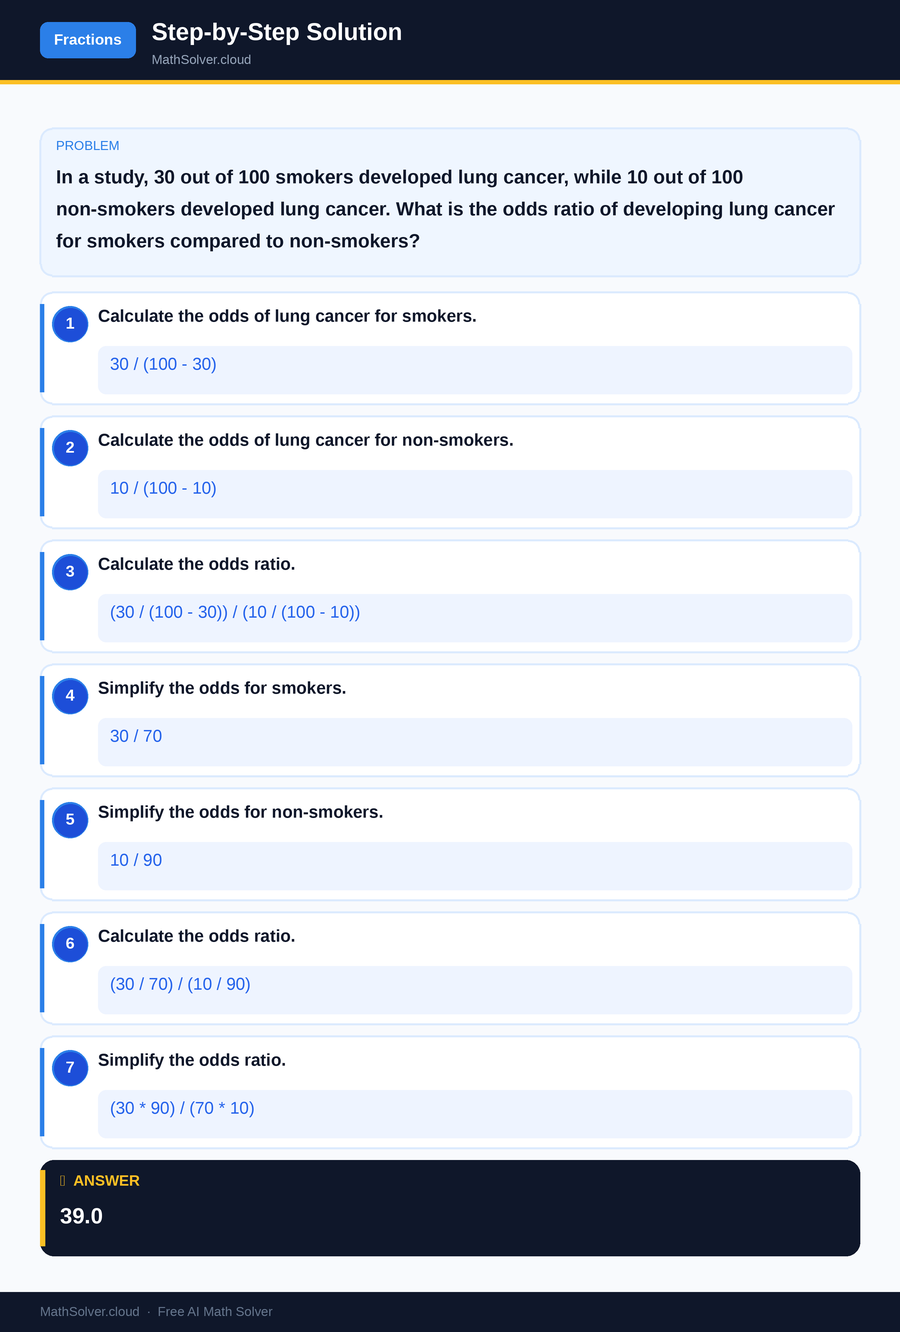
MathSolver Chrome extension solving this problem step-by-step
Example 2
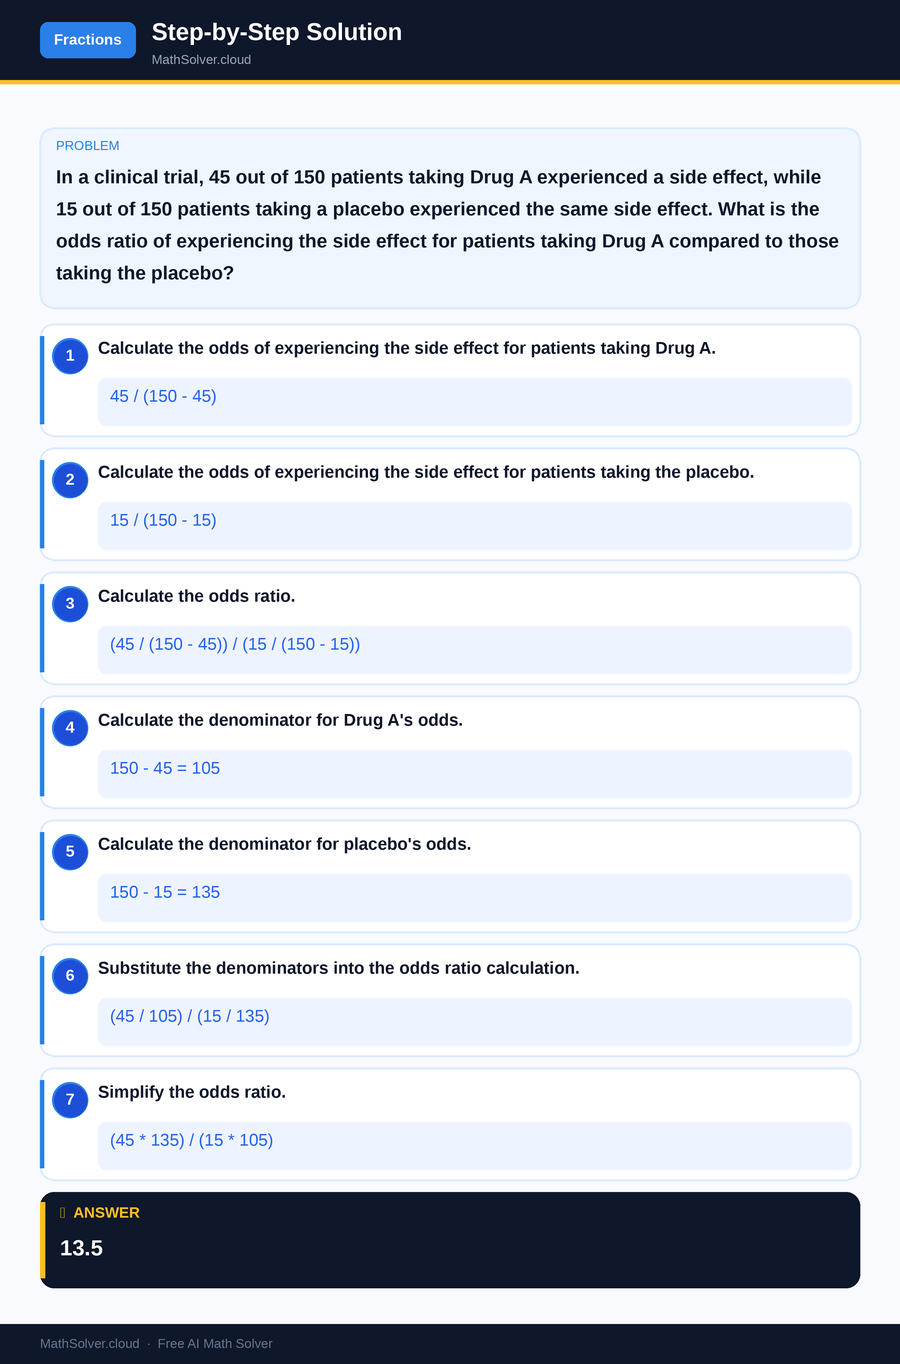
MathSolver Chrome extension solving this problem step-by-step
Common Mistakes to Avoid
One common mistake when using the odds ratio equation is misinterpreting the odds ratio value. It's crucial to remember that an odds ratio greater than 1 indicates a higher likelihood of the event in the first group, while a value less than 1 indicates a lower likelihood. Confusing these interpretations can lead to incorrect conclusions about the data. To avoid this, always revisit the definition of the odds ratio and double-check your calculations.
Another frequent error is setting up the contingency table incorrectly. Misplacing data points or mislabeling rows and columns can result in inaccurate odds calculations. Ensure that your table accurately reflects the data you are analyzing. Double-check the numbers and labels before proceeding with calculations. This attention to detail is vital for obtaining reliable results and making sound data-driven decisions.
Real-World Applications
The odds ratio equation is widely used in healthcare research to assess the risk factors associated with diseases. For example, it helps determine whether a particular lifestyle choice, like smoking, increases the risk of developing certain conditions. By calculating the odds ratio, researchers can quantify the strength of associations, aiding in public health decision-making and policy formulation.
Beyond healthcare, the odds ratio equation is also valuable in social sciences, where it helps analyze the impact of various factors on societal outcomes. For instance, researchers might use it to study the effect of education level on job opportunities or the influence of socioeconomic status on access to healthcare. These applications demonstrate the versatility and importance of understanding the odds ratio equation in real-world contexts.
Frequently Asked Questions
❓ What is the odds ratio equation used for?
❓ How is the odds ratio different from probability?
❓ How can AI help with the odds ratio equation?
❓ How do you interpret an odds ratio of 1?
❓ Can the odds ratio be negative?
🚀 Solve any math problem instantly
2,000+ students use MathSolver every day — join them for free
📥 Add to Chrome — It's Free