How to Solve by Graphing Calculator: A Comprehensive Guide
📋 In this guide
Solve by graphing calculator is a powerful technique that enables students to visualize mathematical problems and find solutions using technology. While graphing calculators can make complex problems more accessible, many students struggle with how to fully utilize these tools. This often results from a lack of familiarity with the calculator's functions or difficulty in interpreting the graphical data. In this article, you'll learn how to solve by graphing calculator, breaking down the process into manageable steps that will enhance your confidence and competence in tackling mathematical equations.
Understanding how to solve by graphing calculator can significantly streamline the problem-solving process in math classes. This skill is particularly beneficial for visual learners who can grasp concepts more readily when they're presented in a graphical form. By the end of this guide, you will not only know how to operate a graphing calculator but also how to interpret the results effectively. Whether you're dealing with algebraic equations or more complex functions, mastering this method can transform your approach to mathematics.
By learning to solve by graphing calculator with steps, students can overcome many of the hurdles they face in subjects like algebra and calculus. This article will guide you through the essential techniques and strategies, offering practical tips and examples. You'll also find advice on avoiding common mistakes and insight into real-world applications of graphing calculators. Equipped with this knowledge, you'll be well-prepared to tackle a wide range of mathematical challenges.
Step-by-Step: How to Solve Solve By Graphing Calculator
Step 1: Familiarize Yourself with the Graphing Calculator
Before you can solve by graphing calculator, it's crucial to understand the basic functions of the device. Most graphing calculators have a similar layout, with buttons for entering equations, accessing different math functions, and viewing graphs. Start by exploring the calculator's manual to get a sense of how to input equations and navigate the graphing features. Practice entering simple equations to become comfortable with the interface, such as using your calculator's "Y=" function to input equations for graphing.
Step 2: Enter the Equations
Once you are comfortable with your calculator, the next step is to enter the equations you need to solve. For example, if you’re solving a single equation or a system of equations, you'll start by pressing the "Y=" button. This allows you to input the equation(s) you want to graph. Make sure to enter each equation accurately, as even a small mistake can lead to incorrect graphs. Double-check your entries to ensure they match the problem you're tackling.
Step 3: Adjust the Viewing Window
After entering your equations, it's important to set the appropriate viewing window on your calculator. This step ensures that you can see the critical points of the graph where solutions may lie. Use the "Window" button to adjust the Xmin, Xmax, Ymin, and Ymax settings. If the graph does not display as expected, you may need to tweak these settings. Start with a standard window and make adjustments based on the problem's requirements or the graph's appearance.
Step 4: Analyze the Graph
With your equations plotted on the screen, the final step is to analyze the graph to find solutions. Look for points where the graphs intersect, as these points represent the solutions to the equations. Use the calculator’s "Calc" menu to find specific points, such as intersections, zeros, or maximum/minimum points. For intersections, select the "Intersect" option and follow the prompts to identify the solution coordinates. Write down the solutions and verify them by substituting them back into the original equations, if necessary.
🤖 Stuck on a math problem?
Take a screenshot and let our AI solve it step-by-step in seconds
⚡ Try MathSolver Free →Worked Examples
Example 1
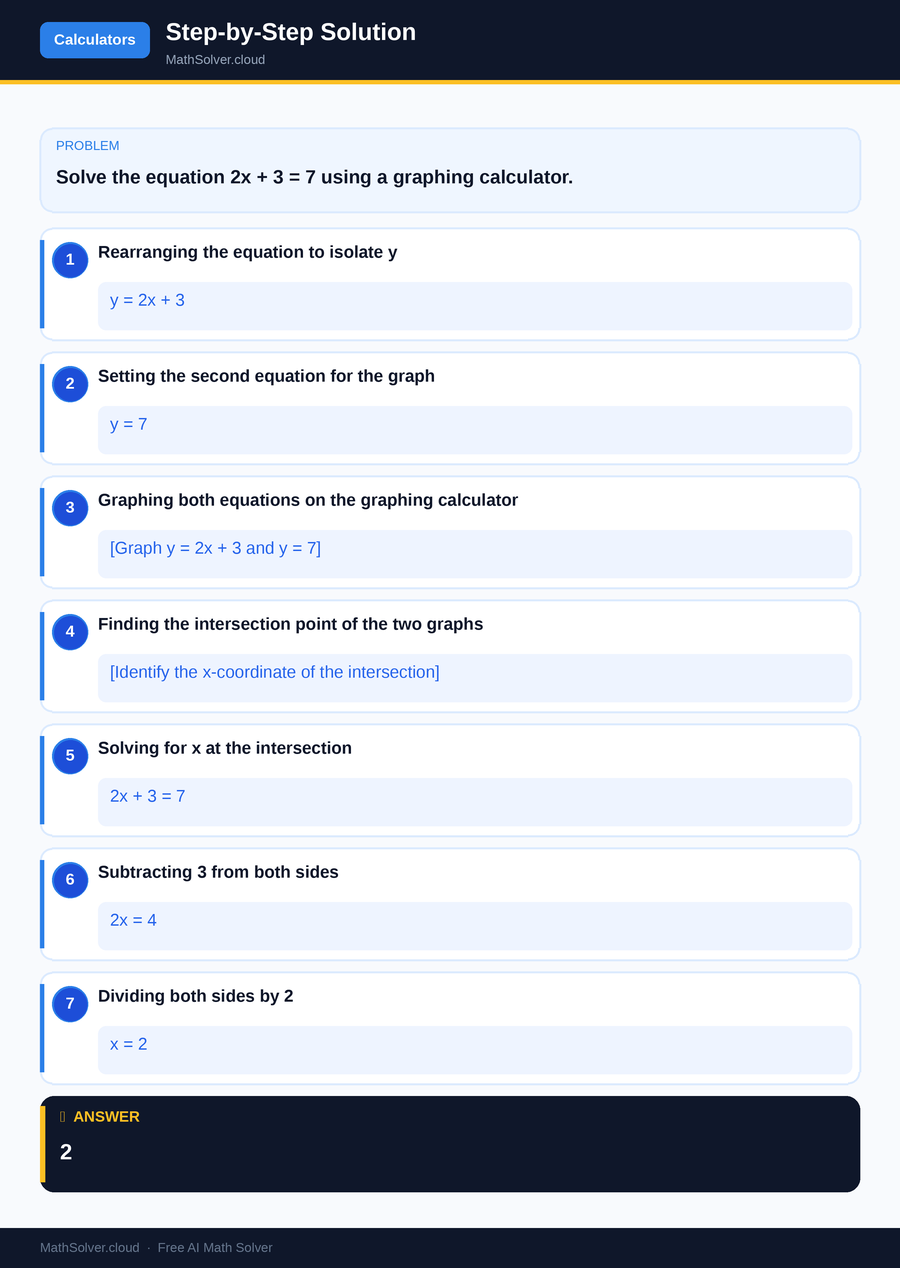
MathSolver Chrome extension solving this problem step-by-step
Example 2
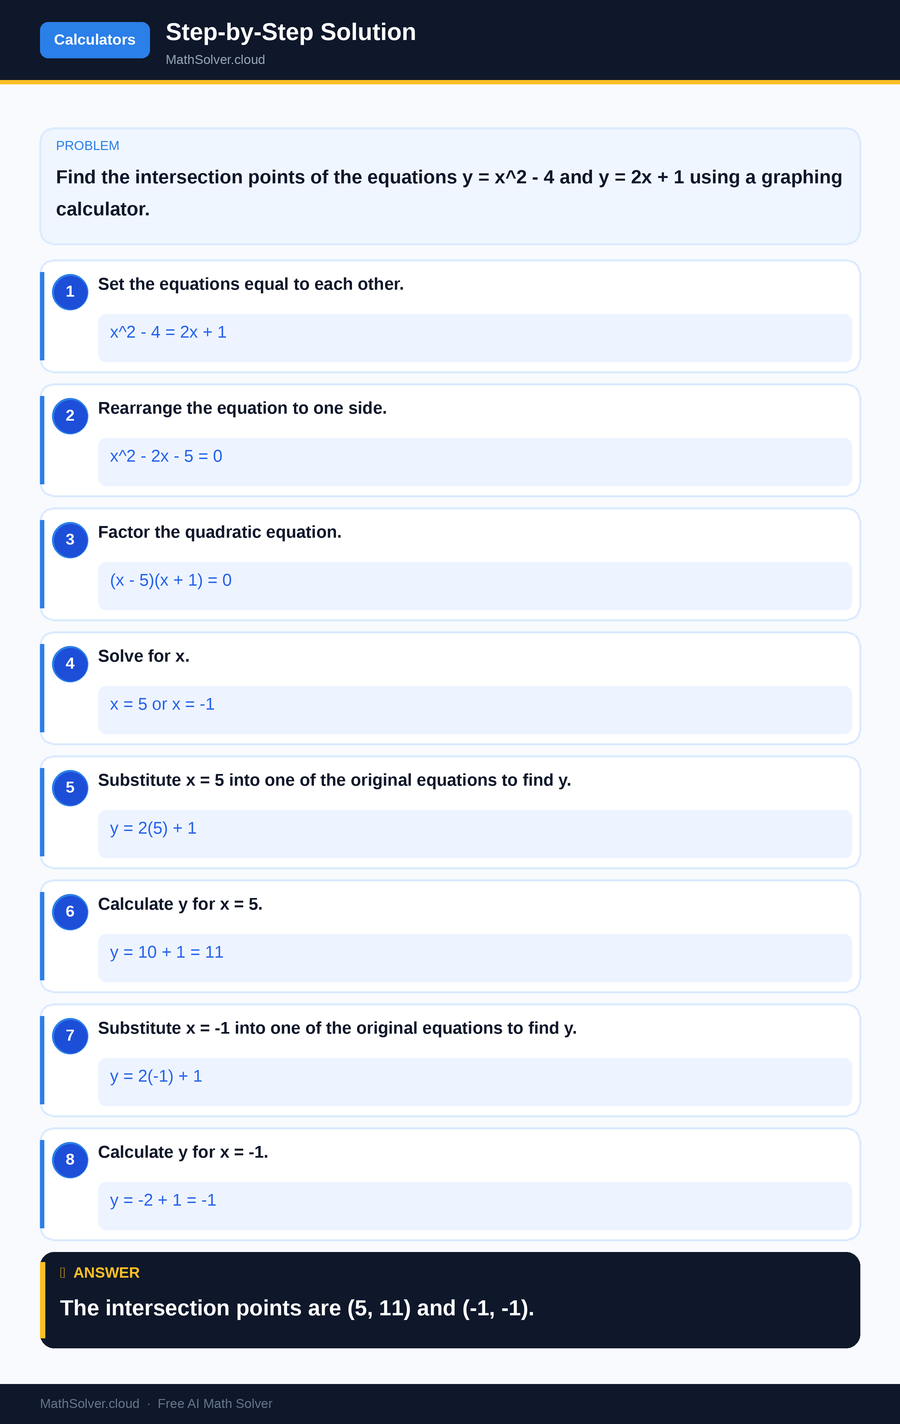
MathSolver Chrome extension solving this problem step-by-step
Common Mistakes to Avoid
One common mistake when you solve by graphing calculator is entering the equations incorrectly. Even minor errors in typing can lead to incorrect graphs and solutions. Always double-check your entries for accuracy before graphing.
Another frequent error is not setting the correct viewing window, which can cause you to miss important features of the graph. If the graph does not look right, adjust the window settings to ensure you can see the entire area of interest.
Students also sometimes rely too heavily on the calculator's output without verifying the results. It's essential to understand the underlying mathematical concepts and verify solutions by substituting them back into the original equations. This practice not only helps confirm the accuracy of the calculator's solutions but also reinforces your understanding of the math involved.
Real-World Applications
The ability to solve by graphing calculator extends beyond the classroom into various real-world applications. Engineers, for example, often use graphing calculators to model and solve complex equations related to design and analysis. By visualizing data, they can make informed decisions about structural integrity and performance.
In finance, professionals use graphing calculators to solve equations related to investment analysis and risk management. By plotting and analyzing financial trends, they can identify optimal investment strategies and forecast market behavior. Thus, mastering the use of graphing calculators can have significant practical benefits in a wide range of fields.
Frequently Asked Questions
❓ How do I solve by graphing calculator if I'm new to using one?
❓ Why does my graph not display correctly even after entering the equation?
❓ How can AI help with solve by graphing calculator?
❓ What should I do if my calculator gives an error message when graphing?
❓ Can I use a graphing calculator for standardized tests?
🚀 Solve any math problem instantly
2,000+ students use MathSolver every day — join them for free
📥 Add to Chrome — It's Free