Mastering the Sample Variance Equation
📋 In this guide
The sample variance equation is a fundamental concept in statistics that measures the spread or dispersion of a set of data points. Students often find this equation challenging because it involves multiple steps, including calculating the mean, subtracting each data point from the mean, and then squaring the result. By the end of this article, you will have a thorough understanding of the sample variance equation, how to compute it, and where it applies in real-world scenarios.
Many students struggle with the sample variance equation because it requires precision in calculations and a good grasp of algebra equations. Missteps in any part of the process can lead to incorrect results. However, understanding this concept is crucial as it lays the foundation for more advanced statistical measures, such as standard deviation and regression analyses.
In this article, we will explore the sample variance equation in depth. You will learn the key formula, follow a step-by-step guide to solve it, and see it applied in examples. Additionally, we will discuss common mistakes and real-world applications to solidify your understanding. Whether you're tackling mystatlab homework answers statistics or trying to determine which regression equation best fits the data, mastering sample variance is essential.
Step-by-Step: How to Solve Sample Variance Equation
Step 1: Calculate the Mean
To begin with, calculate the mean (average) of the data set. Add all the data points together and then divide by the number of data points. This provides a central value that you will use to determine how much each data point deviates. For instance, if your data set is 4, 8, 6, 5, 3, you would add these numbers to get a total of 26. Then, divide 26 by 5 (the number of data points) to get a mean (x_bar) of 5.2.
Step 2: Compute the Deviations from the Mean
Next, subtract the mean from each data point to find the deviation of each point from the mean. This step highlights the difference between each individual data point and the overall average of the data set. Using the previous example, you would compute the deviations as follows: (4 - 5.2), (8 - 5.2), (6 - 5.2), (5 - 5.2), (3 - 5.2). This results in deviations of -1.2, 2.8, 0.8, -0.2, and -2.2 respectively.
Step 3: Square Each Deviation
Once the deviations are calculated, square each one. This step eliminates negative values and emphasizes larger deviations more than smaller ones, which is crucial for calculating variance. Continuing with our example, square each deviation: (-1.2)^2 = 1.44, (2.8)^2 = 7.84, (0.8)^2 = 0.64, (-0.2)^2 = 0.04, and (-2.2)^2 = 4.84.
Step 4: Calculate the Sample Variance
Finally, sum the squared deviations and divide by (n - 1), where n is the number of data points in the sample. This gives you the sample variance. In our example, the sum of the squared deviations is 14.8. Divide this by (5 - 1) = 4, resulting in a sample variance (s^2) of 3.7.
🤖 Stuck on a math problem?
Take a screenshot and let our AI solve it step-by-step in seconds
⚡ Try MathSolver Free →Worked Examples
Example 1
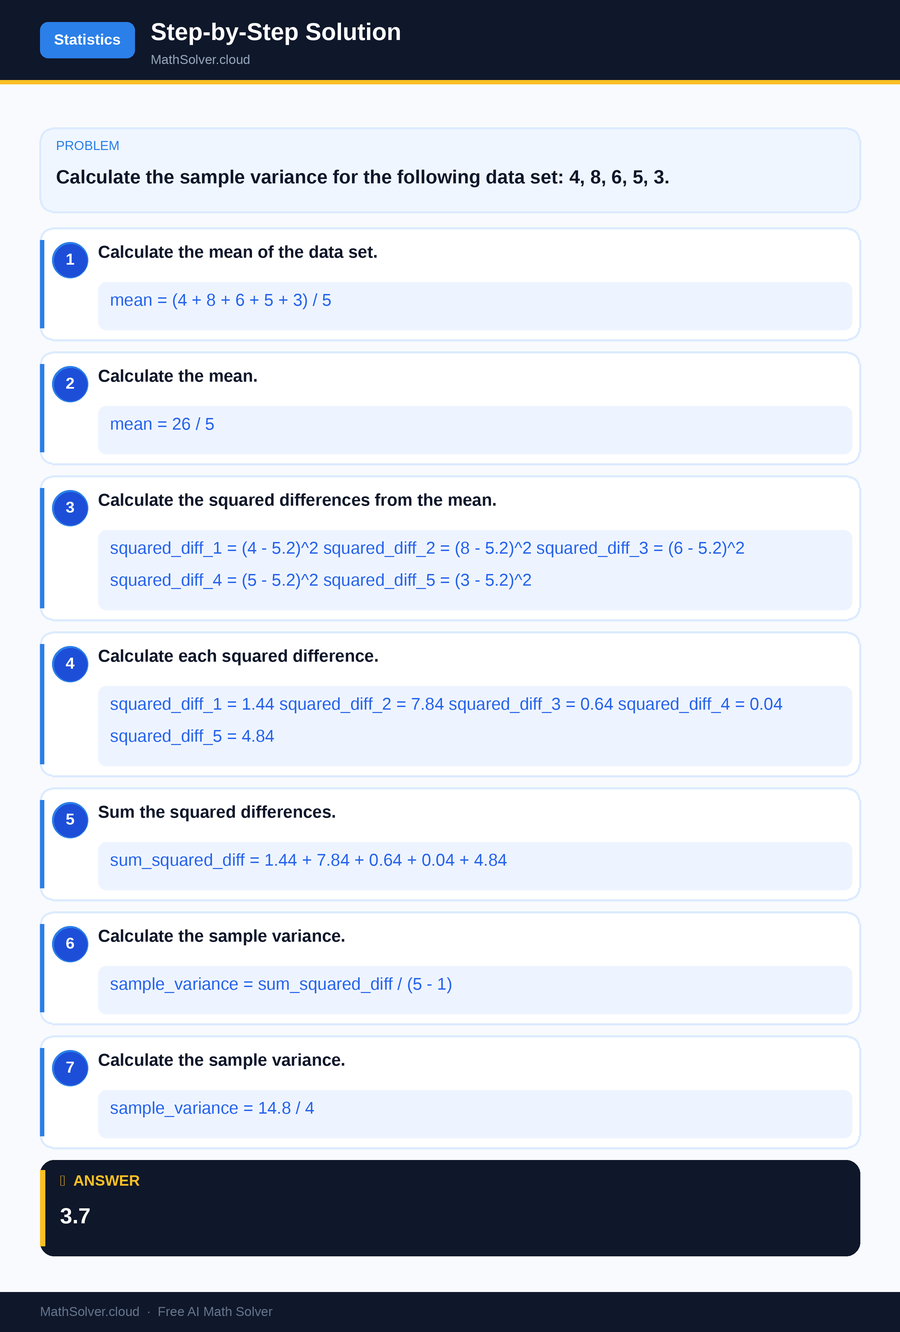
MathSolver Chrome extension solving this problem step-by-step
Example 2
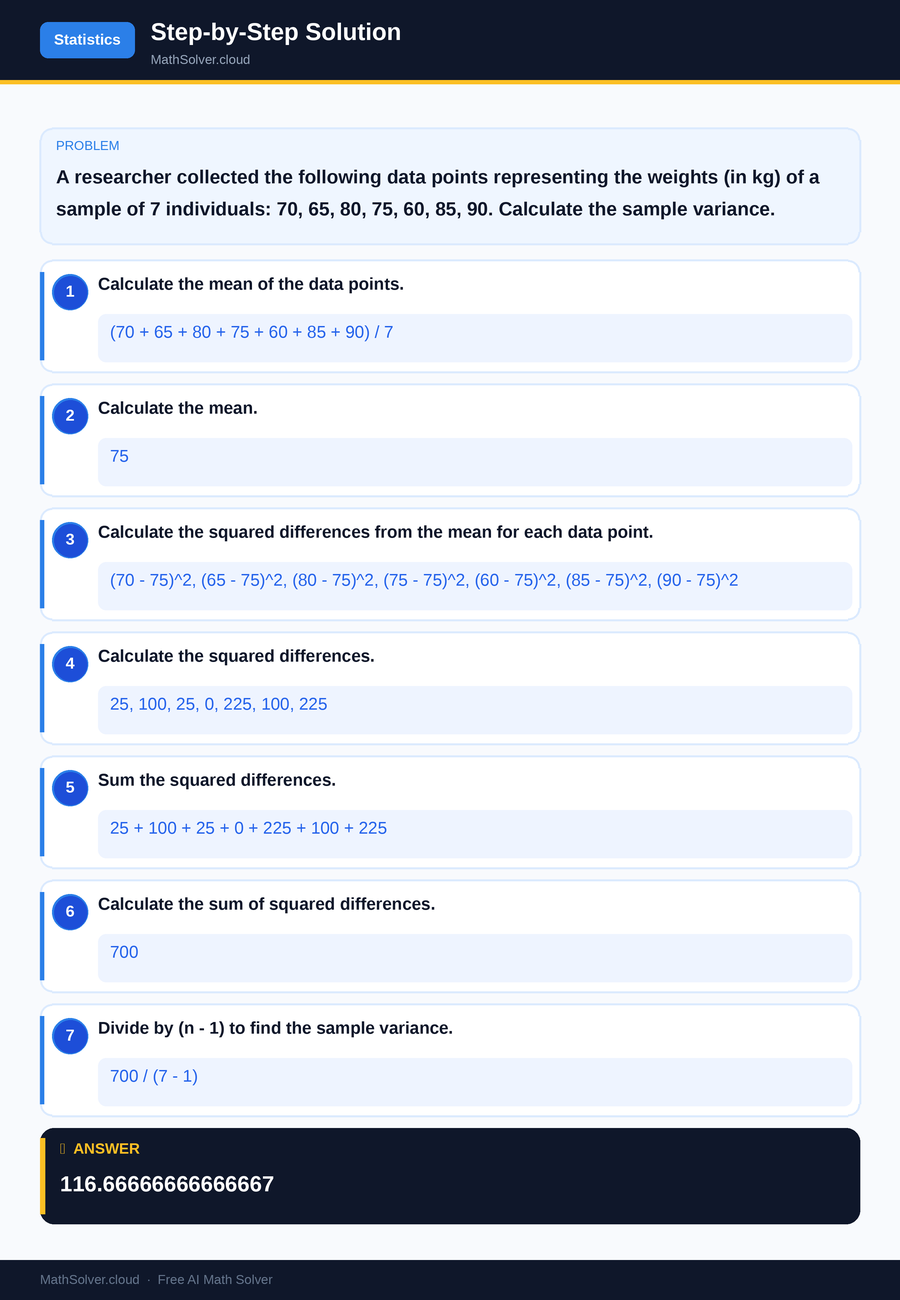
MathSolver Chrome extension solving this problem step-by-step
Common Mistakes to Avoid
One common mistake when calculating the sample variance is forgetting to subtract one from the number of data points (n - 1) when dividing the sum of the squared deviations. This step accounts for the degrees of freedom in the sample and is crucial for obtaining an unbiased estimate of the population variance.
Another error is miscalculating the mean, which can lead to incorrect deviations and, ultimately, an incorrect variance. It is important to double-check each step, especially when finding deviations and squaring them, as small arithmetic errors can significantly impact the final result.
Real-World Applications
The sample variance equation is widely used in fields such as finance, where it helps assess the volatility of a stock's returns. Investors use variance to understand the risk associated with an investment, as a higher variance indicates greater volatility.
In quality control, manufacturers use sample variance to monitor the consistency of their products. By comparing the variance of different batches, they can identify potential issues in the production process and ensure that the products meet quality standards.
Frequently Asked Questions
❓ What is the sample variance equation used for?
❓ How is sample variance different from population variance?
❓ How can AI help with the sample variance equation?
❓ What is the relationship between sample variance and standard deviation?
❓ Can sample variance be negative?
🚀 Solve any math problem instantly
2,000+ students use MathSolver every day — join them for free
📥 Add to Chrome — It's Free