Mastering the Variance Equation
📋 In this guide
The variance equation is a fundamental concept in statistics that measures how much a set of numbers differs from the average of that set. Understanding this equation is crucial for students and professionals dealing with data, as it provides insights into the variability and consistency within a dataset. However, many students struggle with the variance equation due to its mathematical complexity and the abstract nature of statistical concepts. The variance equation is not just a mathematical formula; it is a tool for making sense of data in a world inundated with information.
In this article, we will explore the variance equation in depth, breaking it down into digestible parts. You'll learn not just the formula, but how to apply it step-by-step and interpret its results. We will also address common mistakes that students make when working with variance and provide practical examples to illustrate its real-world applications. By the end of this guide, you will have a comprehensive understanding of the variance equation and how it fits within the broader context of statistics.
Whether you're a student tackling mystatlab homework answers statistics or a professional in a data-driven field, mastering the variance equation is essential. This article will serve as your go-to resource, offering clarity and guidance as you navigate the complexities of variance and its related concepts. Let's dive in and demystify the variance equation together.
Step-by-Step: How to Solve Variance Equation
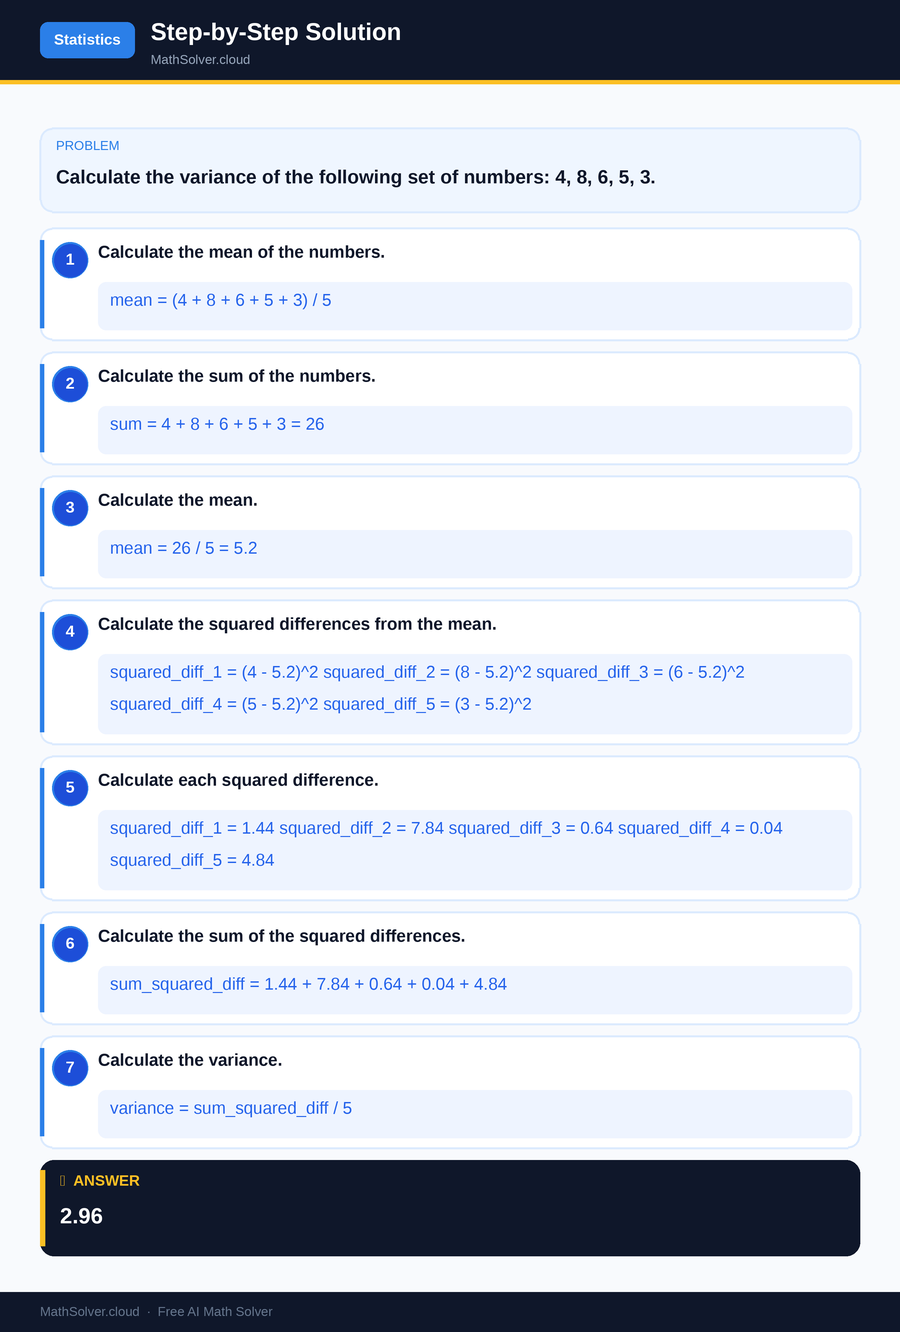
Step 1: Calculate the Mean
Before you can use the variance equation, you need to find the mean (average) of your data set. Add up all the numbers in your data set and then divide by the number of data points. The mean represents the central value around which your data points are dispersed. For example, if your data set is 4, 8, 6, 5, 3, you would calculate the mean as follows: (4 + 8 + 6 + 5 + 3)/5 = 26/5 = 5.2. This step lays the foundation for the variance calculation, as the mean is used in the subsequent steps to find how each data point deviates from it.
Step 2: Find the Deviation from the Mean
Next, for each data point in your set, subtract the mean from the data point to find its deviation from the mean. This step helps you see how each data point differs from the average. Continuing with our example, the deviations would be: (4 - 5.2), (8 - 5.2), (6 - 5.2), (5 - 5.2), and (3 - 5.2). These deviations are essential because they show the spread of the data in relation to the mean. However, simply totaling these deviations would result in zero, as they balance each other out. Therefore, we move to the next step to address this.
Step 3: Square the Deviations
To eliminate negative numbers and emphasize larger deviations, square each of the deviations you calculated in the previous step. This squaring gives more weight to larger differences from the mean and ensures that all values are positive. In our example, the squared deviations would be: (4 - 5.2)^2 = 1.44, (8 - 5.2)^2 = 7.84, (6 - 5.2)^2 = 0.64, (5 - 5.2)^2 = 0.04, and (3 - 5.2)^2 = 4.84. Squaring the deviations is a crucial step as it prevents the positive and negative deviations from canceling each other out. It ensures that the variance reflects the true spread of the data.
Step 4: Calculate the Variance
Finally, sum up all the squared deviations and divide by the number of data points for a population or by one less than the number of data points for a sample. This will give you the variance. Using our example, the variance would be calculated as: (1.44 + 7.84 + 0.64 + 0.04 + 4.84)/5 = 2.96. This final step gives you the variance, a measure of how much your data points differ from the mean. It's a critical piece of the puzzle in understanding data variability. Whether you're using the sample variance equation or the population variance formula, this process provides the insights needed to analyze statistical data effectively.
🤖 Stuck on a math problem?
Take a screenshot and let our AI solve it step-by-step in seconds
⚡ Try MathSolver Free →Worked Examples
Example 1
MathSolver Chrome extension solving this problem step-by-step
Example 2
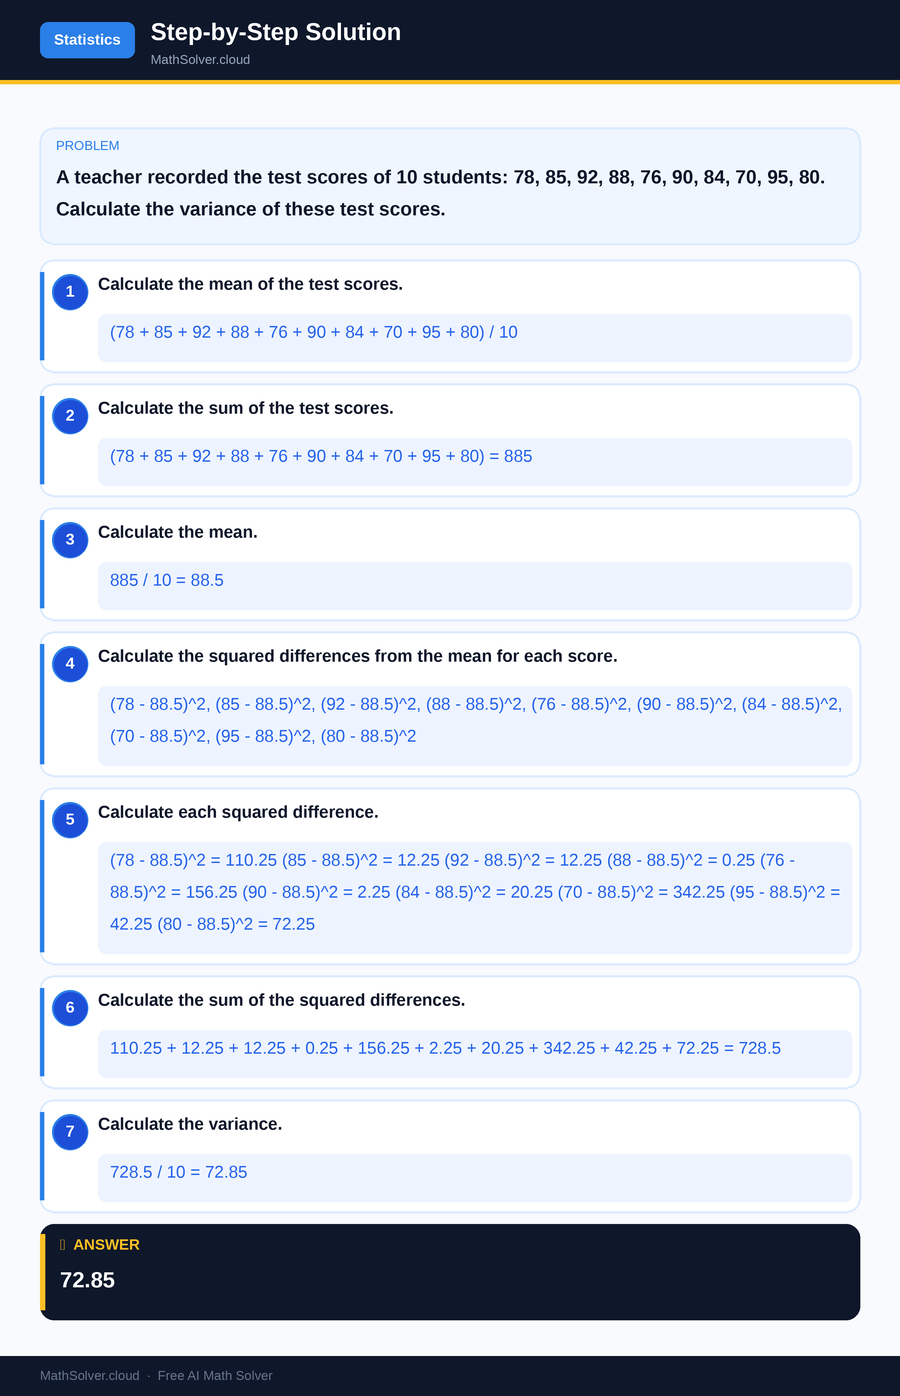
MathSolver Chrome extension solving this problem step-by-step
Common Mistakes to Avoid
One common mistake students make is forgetting to square the deviations when calculating variance. This step is crucial because it ensures that all deviations are positive, giving a true measure of variability. Without squaring, the positive and negative deviations would cancel each other out, leading to an incorrect variance value. Always remember to square the deviations to avoid this error.
Another frequent error is using the wrong formula for sample variance versus population variance. When dealing with a sample, the variance equation requires dividing by n - 1 instead of n. This distinction, known as Bessel's correction, accounts for the fact that a sample is just an estimate of the population. Make sure to choose the correct formula based on whether your data set is a sample or a population.
Real-World Applications
The variance equation is used extensively in finance to assess the risk associated with different investments. By calculating the variance of returns, investors can determine how much the returns on an investment are likely to fluctuate. A higher variance indicates a riskier investment, while a lower variance suggests more stability.
In quality control, variance helps manufacturers understand the variability in product quality. By analyzing the variance in dimensions, weight, or other product attributes, companies can identify inconsistencies and improve their production processes. This statistical tool is invaluable in maintaining high standards and reducing defects in manufacturing.
Frequently Asked Questions
❓ What is the variance equation and why is it important in statistics?
❓ How does the sample variance equation differ from the population variance equation?
❓ How can AI help with variance equation calculations?
❓ Why do we square the deviations in the variance equation?
❓ How is the variance equation used in regression analysis?
🚀 Solve any math problem instantly
2,000+ students use MathSolver every day — join them for free
📥 Add to Chrome — It's Free