Which Regression Equation Best Fits the Data
📋 In this guide
Which regression equation best fits the data is a fundamental question in statistics that involves finding the mathematical relationship between variables in a dataset. Many students find this topic challenging because it requires not only understanding different types of regression models but also applying mathematical concepts to determine the best fit. This article will help you navigate through these complexities, providing you with a clear understanding of how to identify the most suitable regression equation for any given set of data.
Understanding which regression equation best fits the data is crucial because it allows you to make accurate predictions and informed decisions based on the data trends. Whether you're a student struggling with mystatlab homework answers in statistics or a researcher trying to interpret experimental results, mastering this skill is essential. By the end of this article, you'll be equipped with the knowledge to confidently determine the best-fitting regression model for your data.
In the following sections, we'll break down the process of selecting the best regression equation into manageable steps, provide detailed examples, and highlight common pitfalls to avoid. We'll also explore real-world applications and answer frequently asked questions to ensure you have a well-rounded understanding of the topic. Let's dive in and demystify the process of determining which regression equation best fits the data.
Step-by-Step: How to Solve Which Regression Equation Best Fits The Data
Step 1: Plot the Data
The first step in determining which regression equation best fits the data is to visualize your dataset. By plotting the data points on a graph, you can get a sense of the general trend or pattern. This initial visualization will help you decide whether a linear model is appropriate or if a more complex regression model is needed. Look for patterns such as linearity, curvature, or clusters, as these will guide your choice of regression model.
Step 2: Choose a Regression Model
Once you have plotted the data, the next step is to select a regression model. If the data appears to have a linear trend, a simple linear regression might suffice. If the data shows a curved trend, consider polynomial regression, which involves equations like y = ax^2 + bx + c. For datasets with exponential growth patterns, exponential regression may be appropriate. Your choice of model should be guided by the pattern observed in the plotted data.
Step 3: Calculate the Regression Equation
After selecting the appropriate regression model, the next step is to calculate the regression equation. For linear regression, you'll need to determine the slope (m) and the y-intercept (b) using formulas such as m = (Nsum of xy - sum of x sum of y) / (Nsum of x^2 - (sum of x)^2) and b = (sum of y - m sum of x) / N, where N is the number of data points. For more complex models, use the corresponding formulas to find the equation that best fits your data.
Step 4: Evaluate the Fit
The final step is to evaluate how well the regression equation fits the data. This can be done by calculating the coefficient of determination, R^2, which measures the proportion of variance in the dependent variable that is predictable from the independent variable. An R^2 value closer to 1 indicates a better fit. Additionally, you can analyze the residuals (the differences between observed and predicted values) to ensure that they are randomly distributed, confirming that the model is appropriate.
🤖 Stuck on a math problem?
Take a screenshot and let our AI solve it step-by-step in seconds
⚡ Try MathSolver Free →Worked Examples
Example 1
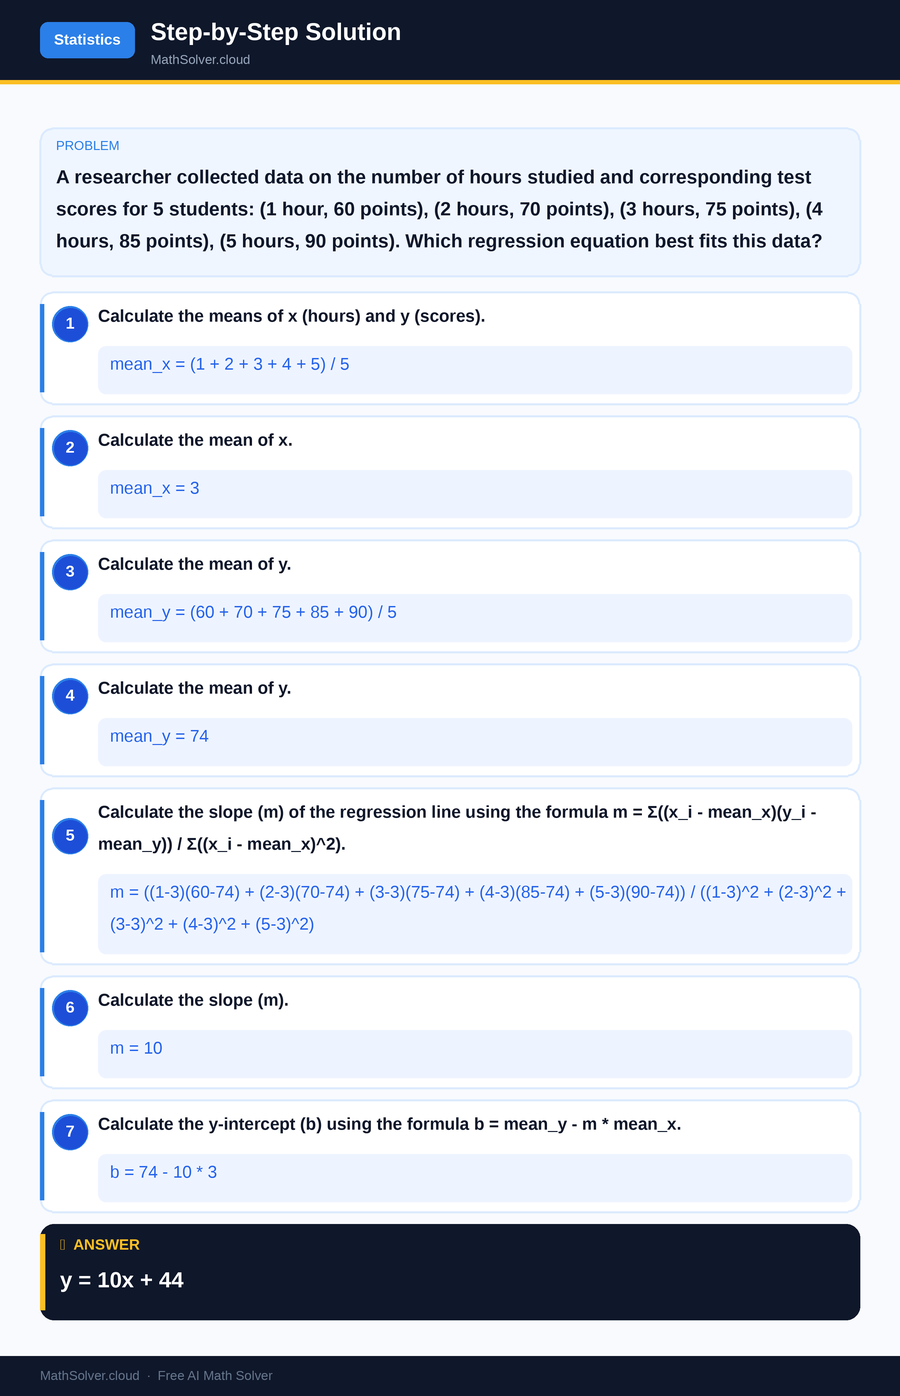
MathSolver Chrome extension solving this problem step-by-step
Example 2
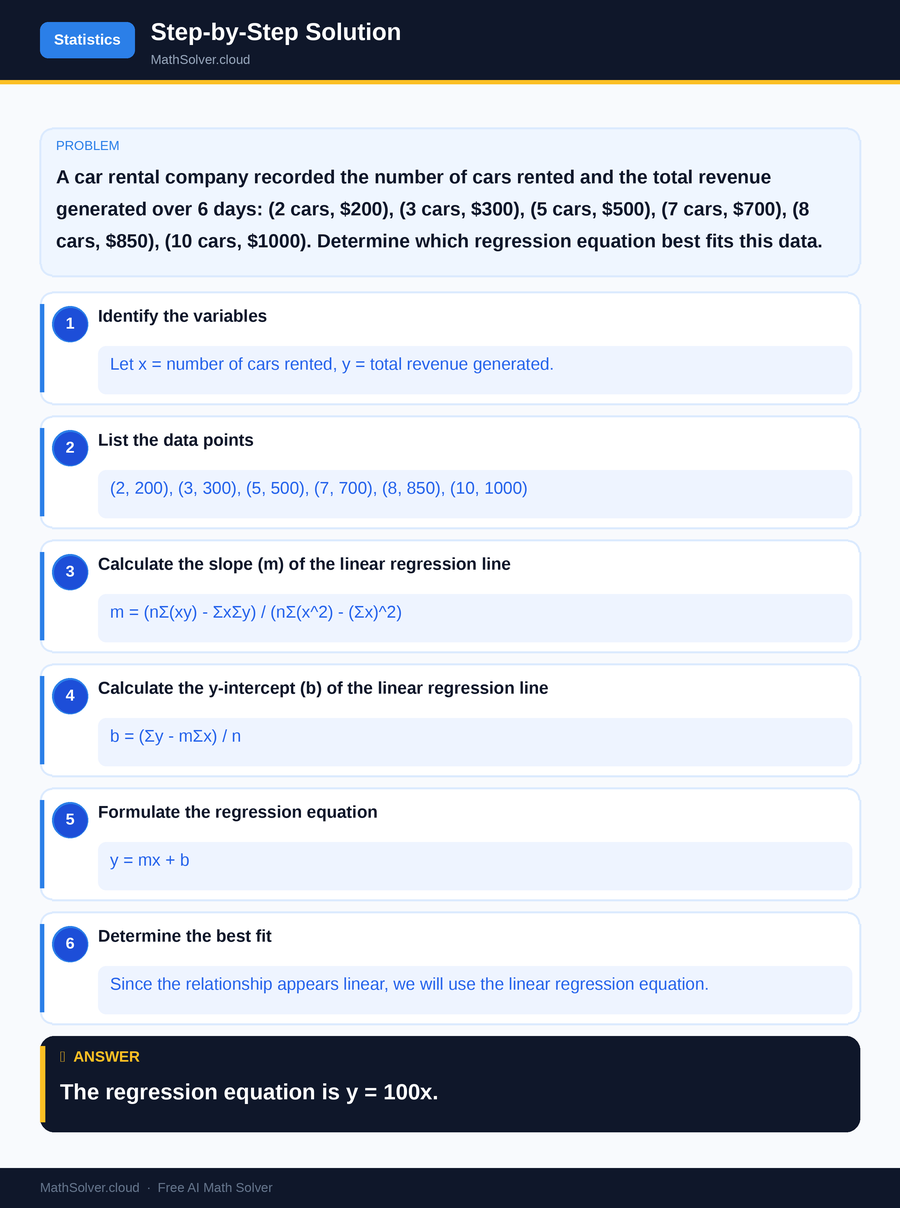
MathSolver Chrome extension solving this problem step-by-step
Common Mistakes to Avoid
One common mistake students make when determining which regression equation best fits the data is failing to visualize the data before choosing a model. This can lead to incorrect model selection, especially if the data has a non-linear trend. Always start by plotting your data to visually assess its pattern.
Another frequent error is neglecting to evaluate the fit of the regression equation. Simply calculating the equation is not enough; you must also check the R^2 value and analyze the residuals to ensure the model accurately represents the data. Skipping this step can result in overfitting or underfitting your data.
Real-World Applications
Determining which regression equation best fits the data has numerous real-world applications. In economics, for example, businesses use regression analysis to forecast sales and understand market trends, allowing them to make strategic decisions. By analyzing historical sales data, they can predict future performance and adjust their strategies accordingly.
In healthcare, regression models are used to identify relationships between patient characteristics and health outcomes. This can help in developing personalized treatment plans and improving patient care. For instance, analyzing data on patient age, weight, and lifestyle can help predict the likelihood of developing certain diseases.
Frequently Asked Questions
❓ How do I determine which regression equation best fits the data?
❓ What should I do if my data doesn't fit a linear model?
❓ How can AI help with determining which regression equation best fits the data?
❓ Can I use regression analysis for non-numeric data?
❓ How is the concept of which regression equation best fits the data relevant in machine learning?
🚀 Solve any math problem instantly
2,000+ students use MathSolver every day — join them for free
📥 Add to Chrome — It's Free