Mastering the Sample Standard Deviation Equation
📋 In this guide
The sample standard deviation equation is a crucial concept in statistics that helps us understand the variability or spread of a data set. Many students find it challenging because it involves multiple steps and mathematical operations, which can be confusing if you're not familiar with algebra equations or basic statistical concepts. In this article, we'll break down the sample standard deviation equation to help you master it easily. We will cover the key formula, provide a step-by-step guide, and work through examples to solidify your understanding. By the end, you'll know not only how to calculate it but also how it applies to real-world scenarios.
Understanding the sample standard deviation equation is essential because it allows you to measure the dispersion of a sample data set. This is particularly useful when you want to compare different data sets or understand how much individual data points deviate from the mean. Many students struggle with this because the equation requires careful attention to detail in each step, from calculating the mean to squaring differences and taking the square root. However, once you grasp the process, you'll find it an invaluable tool in both academic and real-world settings.
Our goal is to demystify the sample standard deviation equation by providing clear explanations and practical examples. Whether you're tackling mystatlab homework answers in statistics, trying to figure out which regression equation best fits the data, or simply looking to enhance your understanding of statistics, this guide will equip you with the knowledge you need. So, let's dive in and explore the fascinating world of standard deviation.
Step-by-Step: How to Solve Sample Standard Deviation Equation
Step 1: Calculate the Sample Mean
The first step in solving the sample standard deviation equation is to calculate the sample mean (x̄). To do this, sum all the data points in your sample and divide by the number of data points. For instance, if your data set consists of the numbers 4, 8, 6, 5, and 3, you would add them together to get 26 and then divide by 5, resulting in a mean of 5.2. The sample mean is a crucial part of the equation because it serves as a reference point for measuring the deviation of each data point.
Step 2: Calculate Each Deviation
Once you have the sample mean, the next step is to calculate how much each data point deviates from this mean. This is done by subtracting the mean from each data point. Continuing with our example, you would subtract 5.2 from each number in the data set, resulting in deviations of -1.2, 2.8, 0.8, -0.2, and -2.2. These deviations show how far each point is from the mean and are essential for determining the spread of the data set.
Step 3: Square Each Deviation
In this step, you'll square each of the deviations calculated in Step 2. Squaring these deviations serves two purposes: it eliminates negative values and emphasizes larger deviations. In our example, you would square each deviation to get 1.44, 7.84, 0.64, 0.04, and 4.84. These squared deviations are used in the next step to calculate the variance, which is a measure of the data set's spread.
Step 4: Calculate the Sample Standard Deviation
The final step in the sample standard deviation equation is to calculate the standard deviation itself. First, add all the squared deviations together to get the sum, which in our example is 14.8. Then, divide this sum by (n - 1), where n is the number of data points. In our example, n is 5, so you divide 14.8 by 4, resulting in a variance of 3.7. Finally, take the square root of this variance to get the sample standard deviation, which is approximately 1.923. This value indicates the average distance of each data point from the mean.
🤖 Stuck on a math problem?
Take a screenshot and let our AI solve it step-by-step in seconds
⚡ Try MathSolver Free →Worked Examples
Example 1
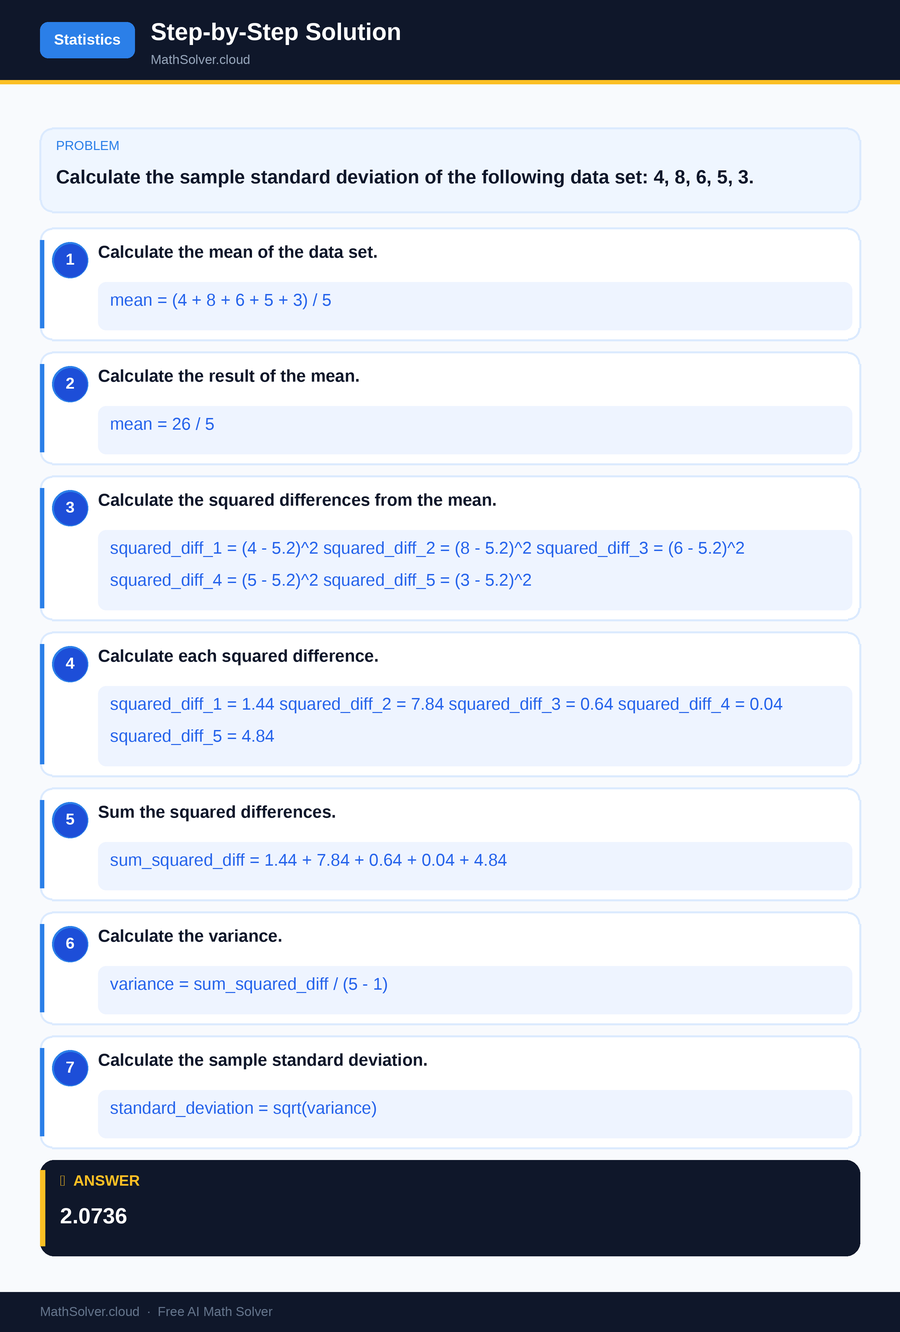
MathSolver Chrome extension solving this problem step-by-step
Example 2
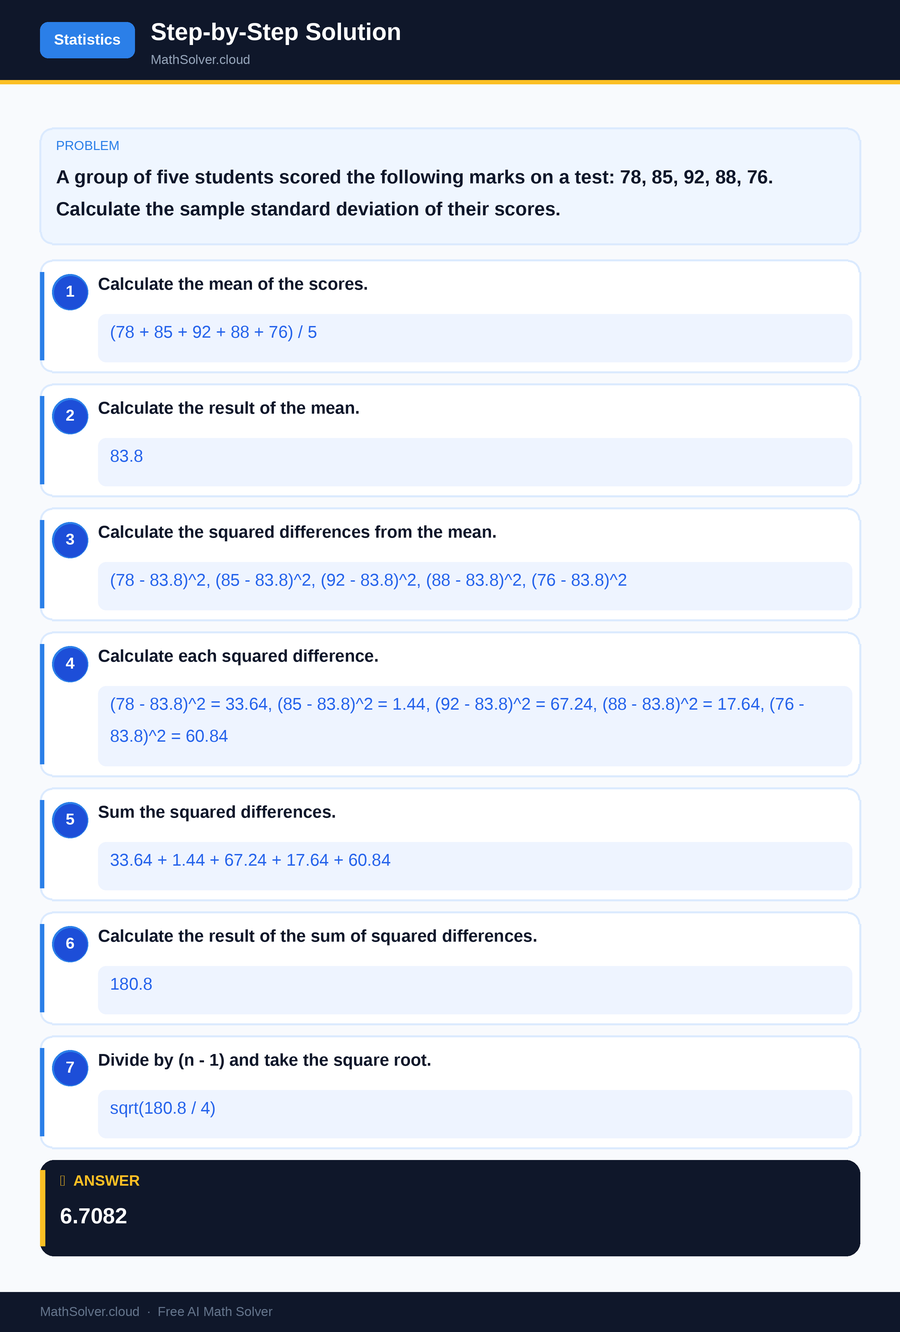
MathSolver Chrome extension solving this problem step-by-step
Common Mistakes to Avoid
One common mistake students make with the sample standard deviation equation is forgetting to subtract the mean from each data point before squaring the deviations. This error can lead to incorrect variance and standard deviation calculations. Always ensure that you carefully follow each step in sequence.
Another frequent mistake is dividing by n instead of (n - 1) when calculating the variance for a sample. This can result in an underestimation of variability, so remember to use (n - 1) to account for the sample size.
Avoiding these mistakes requires attention to detail and practice. Double-check your calculations at each step to ensure accuracy. With practice, using the sample standard deviation equation will become more intuitive, and you'll be less likely to make these common errors.
Real-World Applications
The sample standard deviation equation is used in various real-world contexts to measure variability and make informed decisions. For example, in quality control, companies use standard deviation to assess the consistency of product manufacturing. A low standard deviation indicates that products are consistently meeting quality standards, while a high standard deviation might signal issues that need addressing.
In finance, the standard deviation is a key metric for assessing the risk of investments. A high standard deviation in the returns of a stock indicates higher volatility, which can influence investment strategies. Understanding how to calculate and interpret the sample standard deviation equips you with a valuable skill for analyzing real-world data and making data-driven decisions.
Frequently Asked Questions
❓ What is the sample standard deviation equation used for?
❓ Why is it important to use (n - 1) in the sample standard deviation equation?
❓ How can AI help with the sample standard deviation equation?
❓ What is the difference between variance and standard deviation?
❓ How does the sample standard deviation differ from the population standard deviation?
🚀 Solve any math problem instantly
2,000+ students use MathSolver every day — join them for free
📥 Add to Chrome — It's Free