Demystifying the Regression Equation
📋 In this guide
A regression equation is a powerful mathematical tool used to describe the relationship between two or more variables. It is a fundamental concept in statistics and is frequently used in various fields, including economics, biology, and social sciences. However, many students find the concept of regression equations challenging due to the complexity of the calculations and the need to interpret the results correctly. This article aims to demystify the topic by breaking it down into understandable parts, providing clear explanations, and offering practical examples.
Understanding regression equations is essential for anyone looking to analyze data trends and make predictions based on statistical models. Students often struggle with the nuances of determining which regression equation best fits the data they have. By the end of this article, you'll have a solid grasp of how to construct and interpret a regression equation, and you'll be equipped with strategies to tackle related problems confidently.
This article will guide you through the key formula, provide a step-by-step process for solving regression problems, and offer worked examples to illustrate how regression equations are applied in real-world scenarios. Additionally, we'll highlight some common mistakes to avoid and explore practical applications of regression equations. You'll also find answers to frequently asked questions, providing further insights into this essential statistical tool.
Step-by-Step: How to Solve Regression Equation
Step 1: Collect and Prepare Data
The first step in using a regression equation is to collect and prepare your data. Data collection involves gathering information on the variables you are interested in studying. For example, if you're analyzing the relationship between hours studied and test scores, you'll need to collect data on these two variables for a sample of students. Once collected, it's crucial to prepare the data by organizing it into a clear format, such as a table or spreadsheet, ensuring that all entries are accurate and complete. Data preparation also involves checking for outliers or errors that could skew your results.
Step 2: Determine the Line of Best Fit
Once the data is prepared, the next step is to determine the line of best fit. This line represents the regression equation that best describes the relationship between the variables. Using statistical software or a regression equation calculator can simplify this process. The goal is to find the slope ('a') and y-intercept ('b') that minimize the difference between the observed values and the values predicted by the regression equation. This is often done using the least squares method, which calculates the line that minimizes the sum of the squared differences between the observed and predicted values.
Step 3: Calculate the Regression Equation
With the slope and y-intercept determined, you can now calculate the regression equation. This involves substituting the values of 'a' and 'b' into the equation Y = aX + b. This equation will allow you to make predictions about the dependent variable (Y) based on different values of the independent variable (X). It's important to understand the significance of the slope and y-intercept, as they provide insights into the nature of the relationship between the variables.
Step 4: Interpret the Results
The final step is to interpret the results of your regression equation. This involves analyzing the slope and y-intercept to understand the relationship between the variables. A positive slope indicates that as the independent variable increases, the dependent variable also increases, while a negative slope suggests the opposite. Additionally, it's essential to assess the strength and reliability of the regression model, often by examining the correlation coefficient and the R-squared value. These metrics provide insights into how well the regression equation explains the variability in the data.
🤖 Stuck on a math problem?
Take a screenshot and let our AI solve it step-by-step in seconds
⚡ Try MathSolver Free →Worked Examples
Example 1
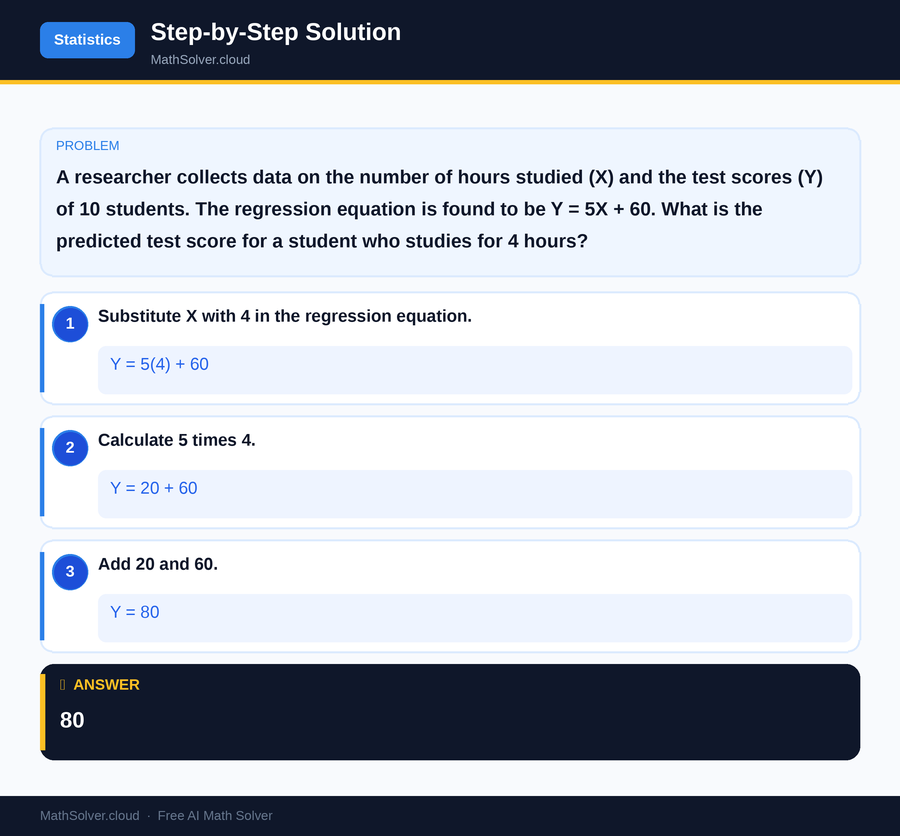
MathSolver Chrome extension solving this problem step-by-step
Example 2
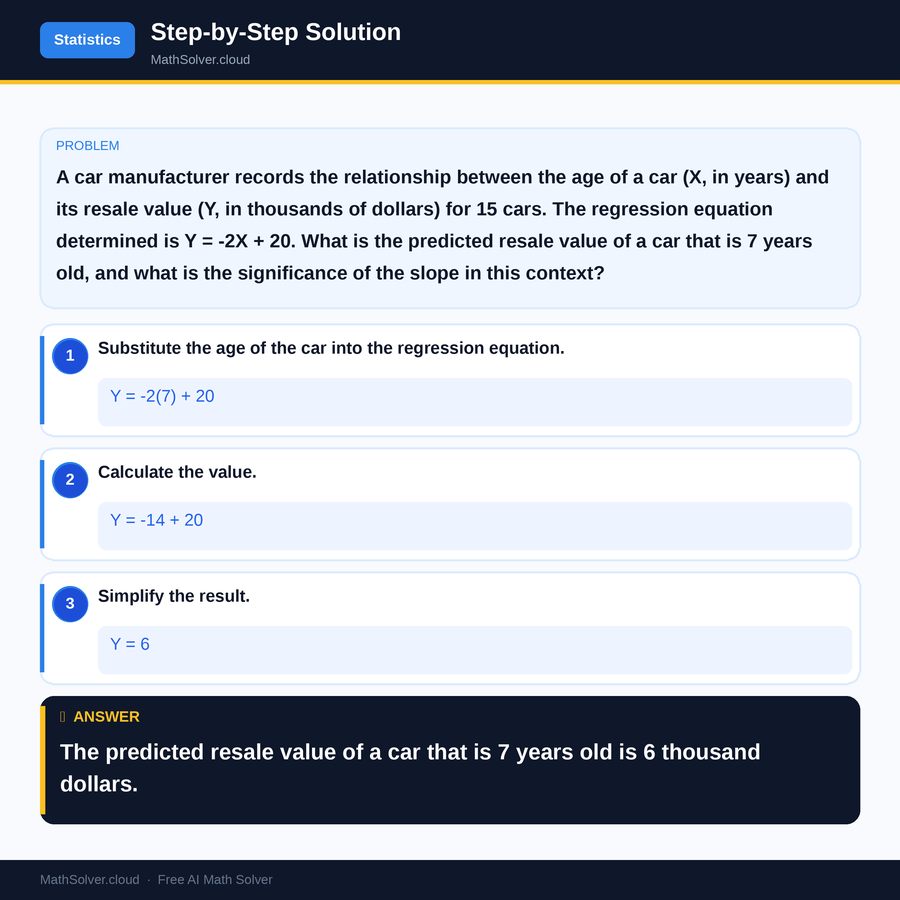
MathSolver Chrome extension solving this problem step-by-step
Common Mistakes to Avoid
One common mistake students make when working with regression equations is incorrectly interpreting the slope and y-intercept. It's crucial to understand that the slope represents the rate of change between variables, while the y-intercept is the predicted value of Y when X is zero. Misinterpreting these can lead to incorrect conclusions about the data.
Another frequent error is neglecting to check the assumptions of the regression model. For a linear regression equation, it's essential to ensure that the relationship between the variables is linear, the residuals are normally distributed, and there is homoscedasticity. Ignoring these assumptions can result in an inaccurate model that doesn't fit the data well.
Real-World Applications
Regression equations are widely used in various fields to make predictions and inform decision-making. In economics, they can forecast economic growth by analyzing factors like interest rates and consumer spending. Similarly, in biology, regression equations help researchers understand the relationship between environmental factors and species populations.
In marketing, businesses use regression equations to predict sales based on advertising expenditures and market trends. By analyzing past data, companies can optimize their marketing strategies and allocate resources more effectively. These examples illustrate the versatility and practicality of regression equations in real-world scenarios.
Frequently Asked Questions
❓ What is a regression equation used for?
❓ Which regression equation best fits the data?
❓ How can AI help with regression equations?
❓ What is the line of regression equation?
❓ How do you verify the accuracy of a regression model?
🚀 Solve any math problem instantly
2,000+ students use MathSolver every day — join them for free
📥 Add to Chrome — It's Free