Understanding the Mode Math Definition
📋 In this guide
The mode math definition refers to the value that appears most frequently in a data set. In statistics, understanding the mode is crucial because it provides insights into the most common occurrences within a collection of numbers. Students often struggle with the mode math definition because it can sometimes be confused with other measures of central tendency like mean and median. In this article, you'll gain a clear understanding of the mode, learn how to calculate it, and see its practical applications.
The mode is an essential concept in statistics that helps us understand data distribution. Unlike the mean, which gives us the average, or the median, which provides the middle value, the mode highlights the data point that appears the most. This concept can be particularly useful in fields such as market research, quality control, and even in everyday decision-making. By the end of this article, you'll have a comprehensive understanding of the mode math definition and how to apply it effectively, whether you're working on your mystatlab homework answers statistics or analyzing complex data sets.
Understanding the mode also opens the door to other statistical concepts like the variance equation and the standard deviation equation, which further describe data variability. With tools like MathSolver and Mathway, you can explore these concepts more interactively. Our complete Statistics & Probability guide offers more resources to deepen your understanding of these topics.
Step-by-Step: How to Solve Mode Math Definition
Step 1: Organize Your Data
To find the mode, start by organizing your data set from smallest to largest. This makes it easier to see which numbers appear most frequently. For example, if your data set is [5, 3, 9, 3, 8, 5, 3], rearrange it to [3, 3, 3, 5, 5, 8, 9]. By organizing your numbers, you can quickly identify patterns and repeat occurrences.
Step 2: Count the Frequency of Each Number
After organizing the data, count how often each number appears. In our example, the number 3 appears three times, 5 appears twice, 8 and 9 appear once. This step is crucial for identifying which number is the mode. Keep track of these frequencies in a simple table or list for clarity.
Step 3: Identify the Mode
The mode is the number with the highest frequency. From our example, since 3 appears more frequently than any other number, it is the mode of the data set. If two or more numbers tie for the highest frequency, your data set will have multiple modes.
Step 4: Verify Your Work
Finally, verify your results by recounting the frequencies. This step helps ensure that you haven’t made a counting mistake, which is a common error in finding the mode. Double-checking your work is a good practice in any mathematical operation to ensure accuracy.
🤖 Stuck on a math problem?
Take a screenshot and let our AI solve it step-by-step in seconds
⚡ Try MathSolver Free →Worked Examples
Example 1
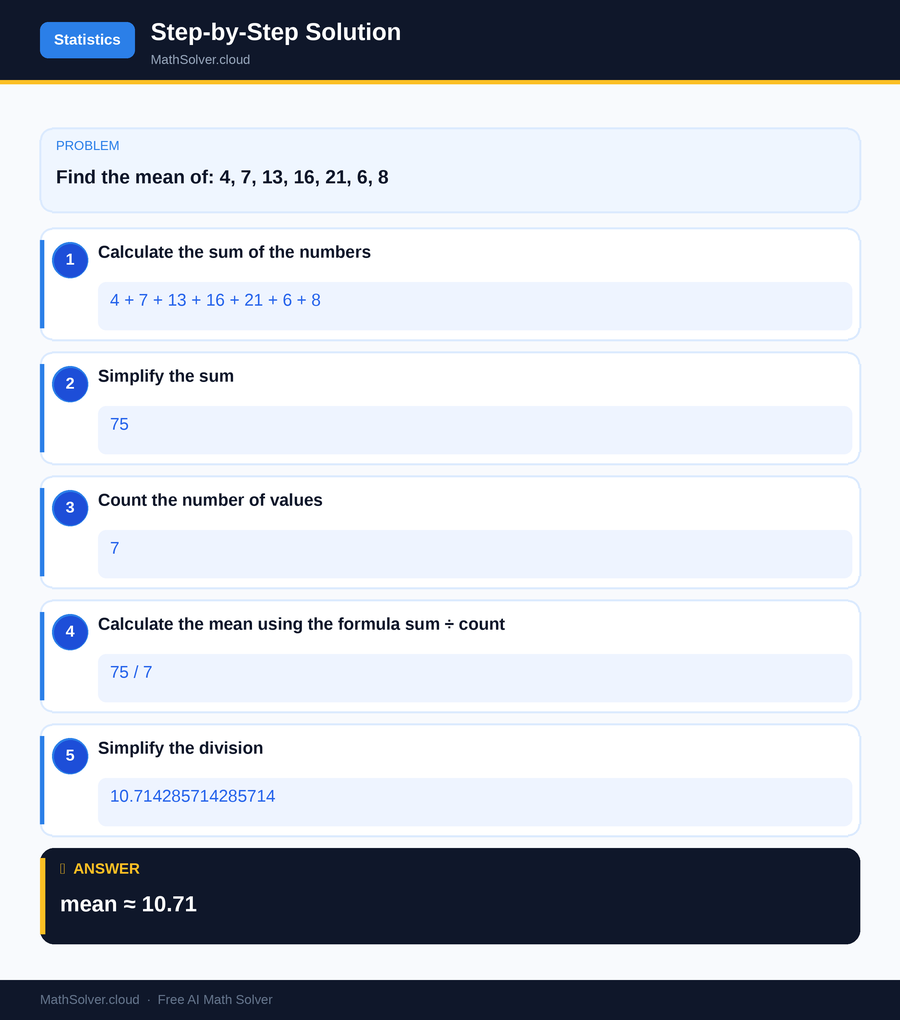
MathSolver Chrome extension solving this problem step-by-step
Example 2
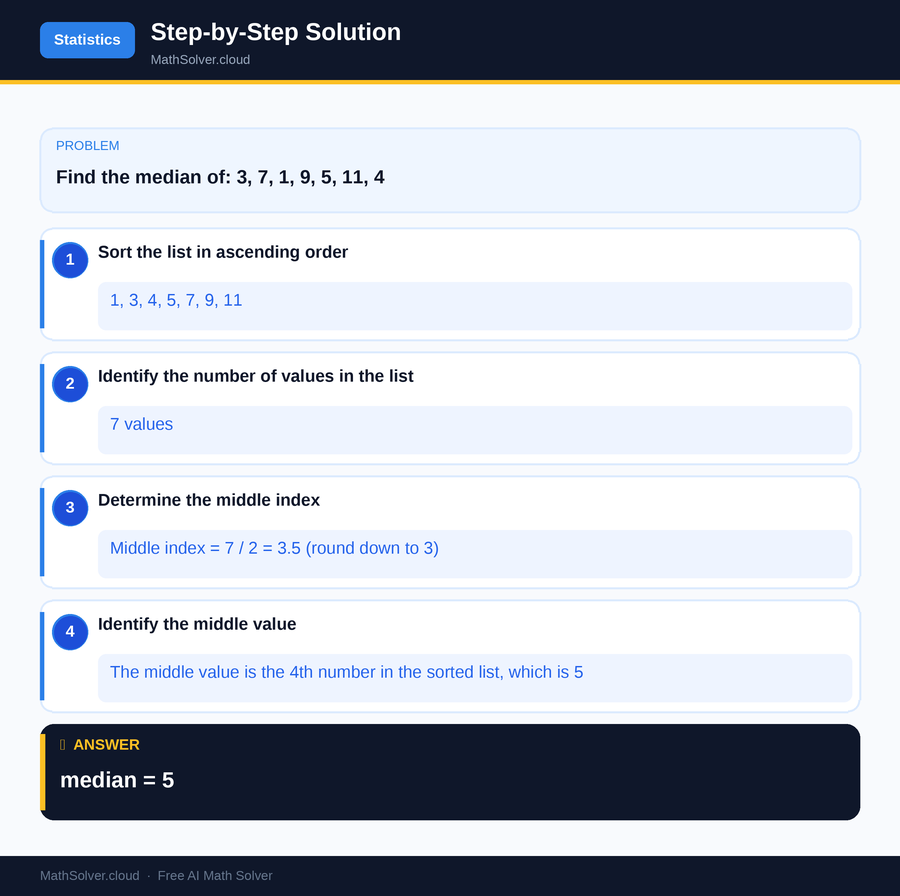
MathSolver Chrome extension solving this problem step-by-step
Common Mistakes to Avoid
One common mistake is assuming the mode is the same as the mean or median. Each measure of central tendency serves a different purpose and provides different insights. The mode specifically identifies the most common value, not the average or middle point. Another error is neglecting to verify your frequency counts, which can lead to incorrect identification of the mode. Always double-check your counts to ensure accuracy.
Additionally, students often overlook multimodal data sets. If two or more numbers share the highest frequency, the data set has multiple modes. Recognizing this ensures a comprehensive understanding of the data distribution. Using tools like MathSolver can help verify your work and avoid such mistakes.
Real-World Applications
Mode math definition has numerous real-world applications. In fashion retail, for example, the mode can help determine the most popular clothing sizes to stock. By analyzing sales data, retailers can identify which sizes are purchased most frequently, allowing them to adjust inventory accordingly.
In the realm of technology, mode analysis can assist in understanding user behavior. For instance, a music streaming service might use the mode to identify the most frequently played songs or genres among users. This information can drive marketing strategies and personalized recommendations, thereby enhancing user engagement.
Frequently Asked Questions
❓ What is the mode math definition in simple terms?
❓ How does the mode differ from the mean and median?
❓ How can AI help with mode math definition?
❓ Can a data set have no mode?
❓ How is the mode used in data analysis?
🚀 Solve any math problem instantly
2,000+ students use MathSolver every day — join them for free
📥 Add to Chrome — It's Free