Understanding Mode Definition Math
📋 In this guide
The concept of "mode definition math" refers to one of the fundamental measures of central tendency in statistics, alongside mean and median. The mode is the value that appears most frequently in a data set. Students often struggle with this concept because it requires distinguishing between similar numbers and understanding the data set's overall distribution. In this article, you'll learn not only what the mode is but also how to identify it in various contexts, avoid common pitfalls, and see where it applies in real-world situations.
Understanding mode definition math is essential for anyone working with data, as it provides insight into the most common occurrences in data sets. While mean and median offer other perspectives, the mode can uniquely highlight trends that other measures might overlook. By mastering this concept, students can better analyze and interpret data, which is a critical skill in fields ranging from statistics to economics.
Students often find mode definition math challenging because it seems straightforward yet can be tricky when dealing with large, complex, or non-numeric data sets. This article will guide you through the process of identifying the mode, offer step-by-step instructions, and present real-life applications and examples to solidify your understanding. Whether you're using a math solver or tackling mystatlab homework answers statistics, having a firm grasp of the mode will enhance your statistical toolkit.
Step-by-Step: How to Solve Mode Definition Math
Step 1: Organize the Data Set
The first step in finding the mode is to organize your data set in a way that makes it easy to identify which number appears most frequently. This often means listing the numbers in numerical order. For example, if you have the data set [3, 7, 8, 5, 3, 8, 9, 2, 3], rearrange it to [2, 3, 3, 3, 5, 7, 8, 8, 9]. By organizing the data, you can easily see which numbers are repeated and how often, making it simpler to identify the mode.
Step 2: Count the Frequency of Each Number
Once your data is organized, count how many times each number appears. In the organized data set [2, 3, 3, 3, 5, 7, 8, 8, 9], you can see that 3 appears three times, 8 appears twice, and all other numbers appear once. Creating a frequency table can be helpful for this step, where you list each number alongside its frequency. This visual aid makes it easier to compare frequencies and identify the mode.
Step 3: Identify the Mode
After counting the frequencies, the mode is the number with the highest frequency. In the example, 3 appears most frequently (three times), making it the mode of the data set. If two numbers share the highest frequency, the data is bimodal, meaning it has two modes. For instance, if 8 also appeared three times, the data set would be bimodal with modes 3 and 8.
Step 4: Interpret the Results
Finally, interpret what the mode tells you about the data set. The mode provides insight into the most common value, which can be useful for understanding trends or making predictions. For example, if you're analyzing test scores and find that the mode is 85, you know that most students scored around 85. By understanding what the mode represents, you can make more informed decisions based on your data.
🤖 Stuck on a math problem?
Take a screenshot and let our AI solve it step-by-step in seconds
⚡ Try MathSolver Free →Worked Examples
Example 1
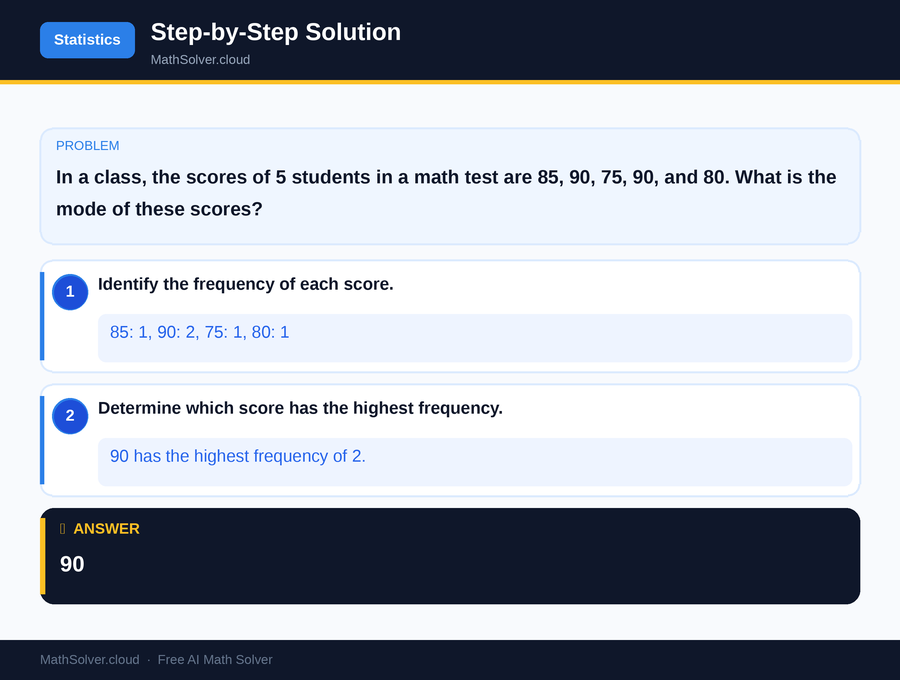
MathSolver Chrome extension solving this problem step-by-step
Example 2
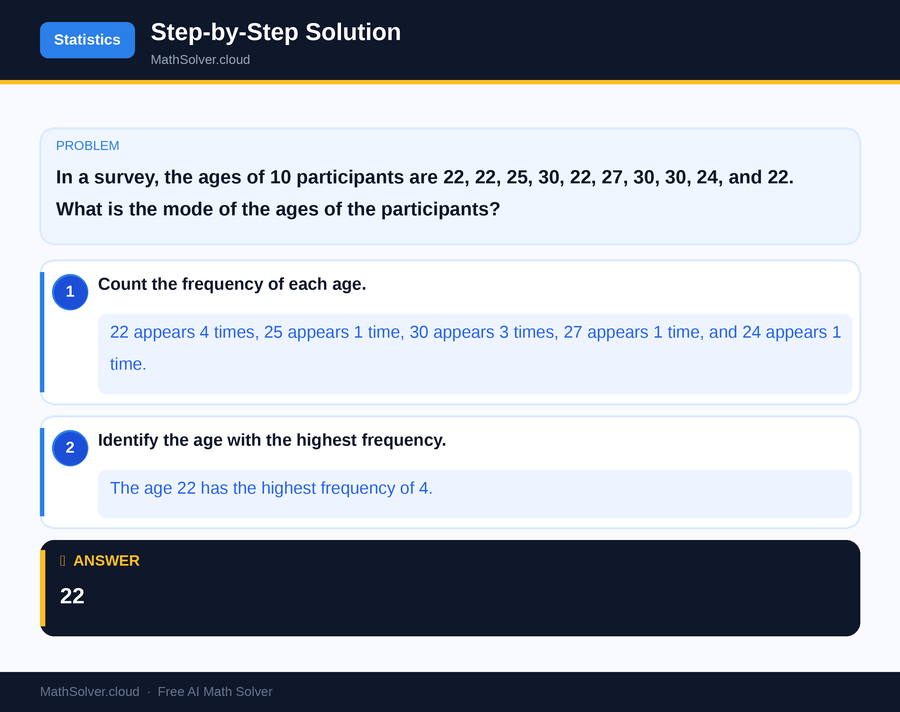
MathSolver Chrome extension solving this problem step-by-step
Common Mistakes to Avoid
One common mistake when learning mode definition math is assuming every data set has a mode. Remember that if no number repeats, there is no mode. Students often overlook this detail, leading to incorrect conclusions. Always check the frequency of each number to determine if a mode exists.
Another error is confusing mode with mean or median. While these measures all serve to describe data, they represent different concepts. The mode focuses on frequency, the mean is the average, and the median is the middle value. Ensure you're clear on what each measure represents to avoid mixing them up. Utilizing tools like mathway can help clarify these distinctions.
Real-World Applications
Mode definition math plays a crucial role in various fields, making it a valuable concept for anyone analyzing data. In marketing, companies might use the mode to identify the most popular product or service among consumers. By knowing what sells most frequently, businesses can tailor their strategies to meet customer demands.
In education, mode is used to interpret test scores, helping educators understand the most common performance level among students. This insight can guide curriculum adjustments or targeted interventions. Mode is also relevant in fields like healthcare, where identifying the most common symptom in a group of patients can aid diagnosis and treatment planning.
Frequently Asked Questions
❓ What is the mode definition math of a data set, and how is it different from mean and median?
❓ Can a data set have more than one mode?
❓ How can AI help with mode definition math?
❓ What if no number repeats in the data set?
❓ How does mode definition math apply to real-world questions like "which regression equation best fits the data"?
🚀 Solve any math problem instantly
2,000+ students use MathSolver every day — join them for free
📥 Add to Chrome — It's Free