Exploring the Mode Definition in Maths
📋 In this guide
The mode definition in maths refers to the number or value that appears most frequently in a given set of data. Understanding the mode is crucial because it provides a simple yet effective way to summarize a dataset. However, students often struggle with identifying the mode, especially when faced with large datasets or when the data is presented in various formats such as lists, charts, or graphs. In this article, we will explore the mode definition in maths, providing clarity and practical solutions to common problems.
Students frequently encounter difficulties with the concept of mode because it requires careful observation and counting. Unlike the mean, which involves calculation, the mode demands an eye for detail. Through this article, learners will grasp the mode definition in maths and learn how to apply this concept effectively in solving problems. By the end of this guide, students will be able to confidently find the mode in any dataset, whether it involves numbers, survey results, or other forms of data.
Our journey will include a straightforward definition, step-by-step guidance on how to find the mode, worked examples, and real-world applications. Whether you are tackling problemes maths on a maths question sheet or using a maths solver, understanding the mode can simplify your task. We will also address common mistakes and provide tips on how to avoid them. So, let's dive into the mode definition in maths and unravel its mysteries together.
Step-by-Step: How to Solve Mode Definition In Maths
Step 1: Organize the Data
The first step in finding the mode is to organize the data. This means listing the numbers or values in ascending or descending order. By doing this, you make it easier to see which numbers appear most frequently. For example, if you have a dataset like 6, 3, 9, 6, 2, 1, organizing it would make it 1, 2, 3, 6, 6, 9. This organization is particularly helpful when dealing with a large set of data or when the data is in a jumbled order.
Step 2: Count the Frequency of Each Value
Once the data is organized, the next step is to count how often each value appears. This involves creating a frequency table or simply tallying the occurrences of each number. For instance, in the dataset 1, 2, 3, 6, 6, 9, the number 6 appears twice, while all other numbers appear only once. This step is crucial as it directly leads to identifying the mode. Be thorough in this step to ensure accuracy in your final answer.
Step 3: Identify the Mode
After counting the frequencies, identify the number with the highest frequency. This number is the mode. In our example, the number 6, which appears twice, is the mode since no other number has a higher frequency. If two or more numbers appear with the same highest frequency, the dataset can have multiple modes. For instance, if another number also appeared twice, the dataset would be bimodal.
Step 4: Verify Your Results
The final step is to verify your results to ensure accuracy. Recheck your frequency counts and make sure you did not overlook any numbers. This step helps in avoiding common errors, such as miscounting or misidentifying the mode. Verification is especially important in complex datasets where numbers or values are close in frequency. By double-checking your work, you can confidently present the correct mode.
🤖 Stuck on a math problem?
Take a screenshot and let our AI solve it step-by-step in seconds
⚡ Try MathSolver Free →Worked Examples
Example 1
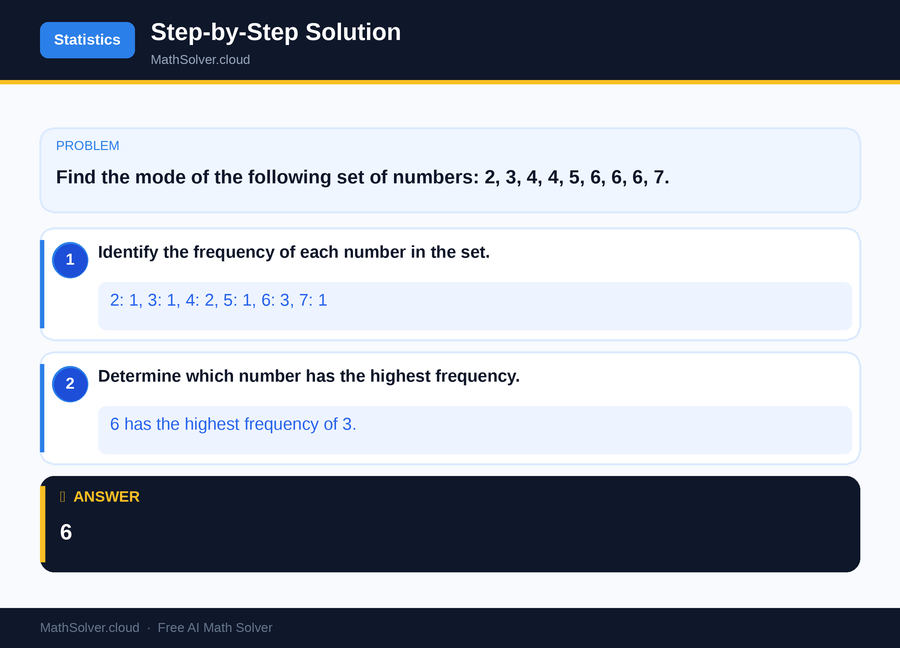
MathSolver Chrome extension solving this problem step-by-step
Example 2
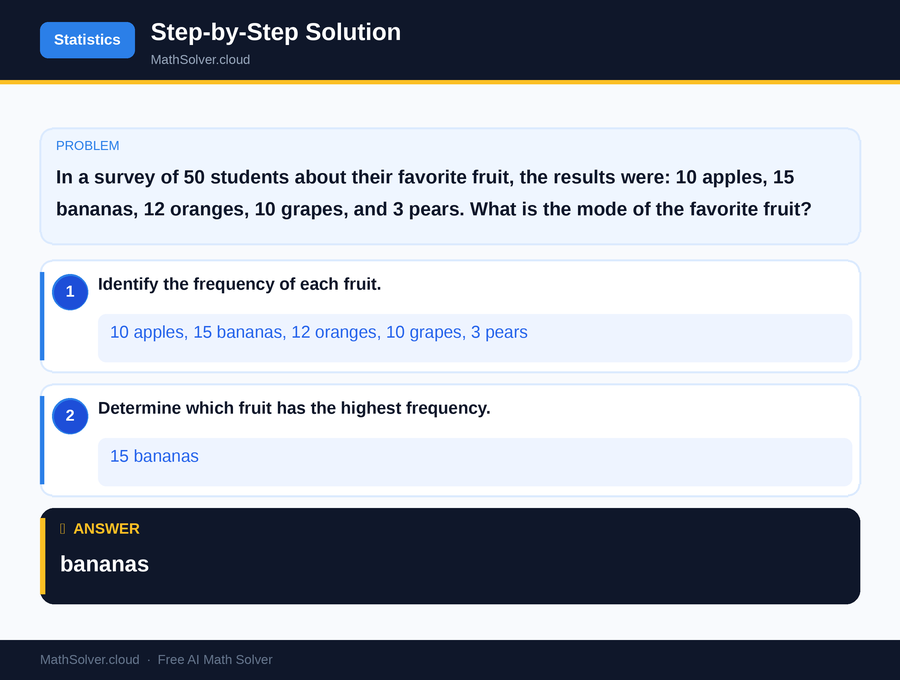
MathSolver Chrome extension solving this problem step-by-step
Common Mistakes to Avoid
One common mistake students make is assuming that the mode is the same as the mean or median, leading to incorrect results. It's important to remember that the mode is solely based on frequency, not an average or a middle value. Another frequent error is neglecting to organize data, which can lead to miscounting the frequencies. Always ensure your data is in order before starting your calculations.
Another pitfall is failing to recognize when a dataset is multimodal or has no mode. If multiple numbers share the highest frequency, all of them are modes, and if no number repeats, the dataset has no mode. Being aware of these scenarios will help you avoid mistakes and accurately solve problemes maths on your maths question sheet.
Real-World Applications
The mode definition in maths plays a vital role in various real-world applications. One common use is in market research, where companies analyze consumer preferences. For example, identifying the most popular product or service among customers helps businesses tailor their offerings to meet demand. Similarly, in social sciences, the mode can determine the most common responses in surveys, providing insights into public opinion.
In educational settings, teachers can use the mode to identify the most common score in a test, helping them assess student performance and adjust teaching methods accordingly. Additionally, understanding mode can aid in data analysis across numerous fields, including economics, healthcare, and environmental studies. For a deep dive into these applications, our complete Statistics & Probability guide offers valuable insights.
Frequently Asked Questions
❓ What is the mode definition in maths?
❓ How do you find the mode if there are multiple numbers with the same frequency?
❓ How can AI help with mode definition in maths?
❓ What’s the difference between mode and mean in math?
❓ Can a dataset have no mode?
🚀 Solve any math problem instantly
2,000+ students use MathSolver every day — join them for free
📥 Add to Chrome — It's Free