Mastering the Math Graphing Calculator
📋 In this guide
A math graphing calculator is an essential tool for students tackling complex mathematical equations. This powerful device allows users to visualize functions, solve equations, and explore data in a visually intuitive manner. Despite its usefulness, many students find themselves struggling to fully harness the potential of a math graphing calculator. The intricacies of setting up equations, understanding graph outputs, and interpreting results can be daunting. In this article, you'll learn how to effectively use a math graphing calculator, navigate its features, and solve problems with confidence.
The main challenge often lies in the initial learning curve associated with using a math graphing calculator. Students may feel overwhelmed by the numerous buttons, symbols, and functions available. This tool, however, is designed to simplify the process of solving equations and visualizing data. By breaking down its functionalities into manageable steps, you will be able to utilize the calculator to its fullest potential, making complex mathematical concepts more accessible.
Throughout this guide, we will explore the practical applications of a math graphing calculator, provide step-by-step instructions for common tasks, and address frequently asked questions. Whether you're using a math graphing calculator online or a physical device, this article will equip you with the knowledge needed to tackle mathematical challenges with ease.
Step-by-Step: How to Solve Math Graphing Calculator
Step 1: Familiarize Yourself with the Calculator's Interface
Before diving into graphing equations, it's crucial to familiarize yourself with the interface of your math graphing calculator. Whether you're using a physical calculator or a math graphing calculator online, take some time to explore the buttons and their functions. Key features to identify include the graphing button, function input area, and the navigation keys. Understanding these basic components will make your experience smoother and more efficient.
Step 2: Entering the Equation
Once you're comfortable with the interface, the next step is to enter your equation. Most calculators have a dedicated button for accessing the graphing mode. After entering this mode, input your equation using the keypad. For instance, if you're graphing y = 2x + 3, input this expression exactly as it appears. Make sure to double-check your entry for accuracy, as a small mistake can significantly alter the graph's outcome.
Step 3: Adjusting the Viewing Window
After entering the equation, you may need to adjust the calculator's viewing window to ensure your graph is displayed properly. The default window settings might not always fit the graph you want to visualize. Use the calculator's window settings to customize the x and y-axis ranges. This will help you capture the most relevant portion of the graph, making it easier to analyze and interpret.
Step 4: Analyzing the Graph
Once your graph is displayed, it's time to analyze the results. Pay attention to key features such as intercepts, slopes, and curvature. For linear equations, identify the slope and y-intercept. For quadratic equations, locate the vertex and determine the direction in which the parabola opens. Understanding these features will help you draw meaningful conclusions from the graph.
🤖 Stuck on a math problem?
Take a screenshot and let our AI solve it step-by-step in seconds
⚡ Try MathSolver Free →Worked Examples
Example 1
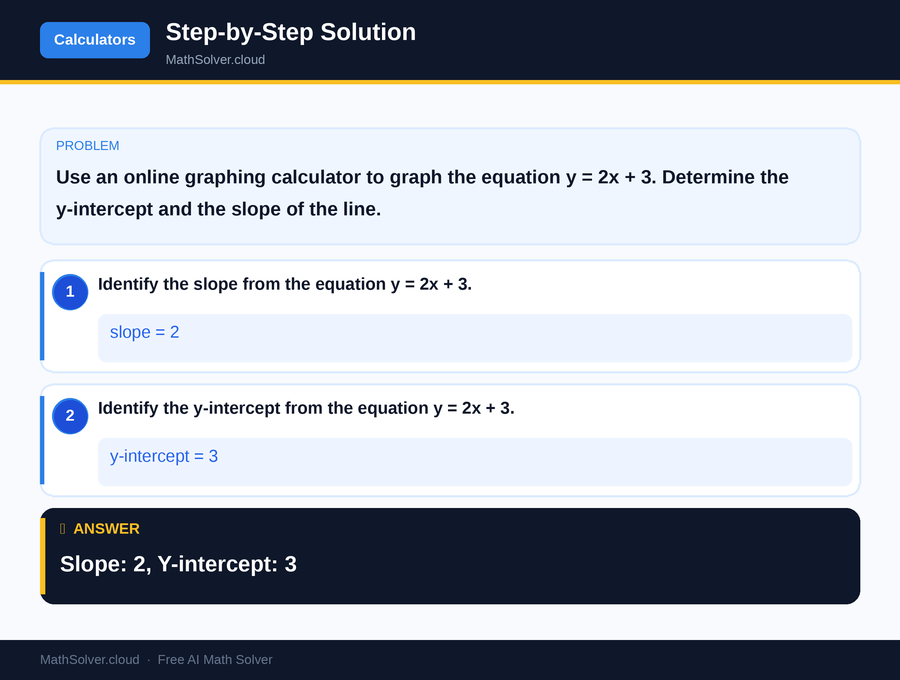
MathSolver Chrome extension solving this problem step-by-step
Example 2
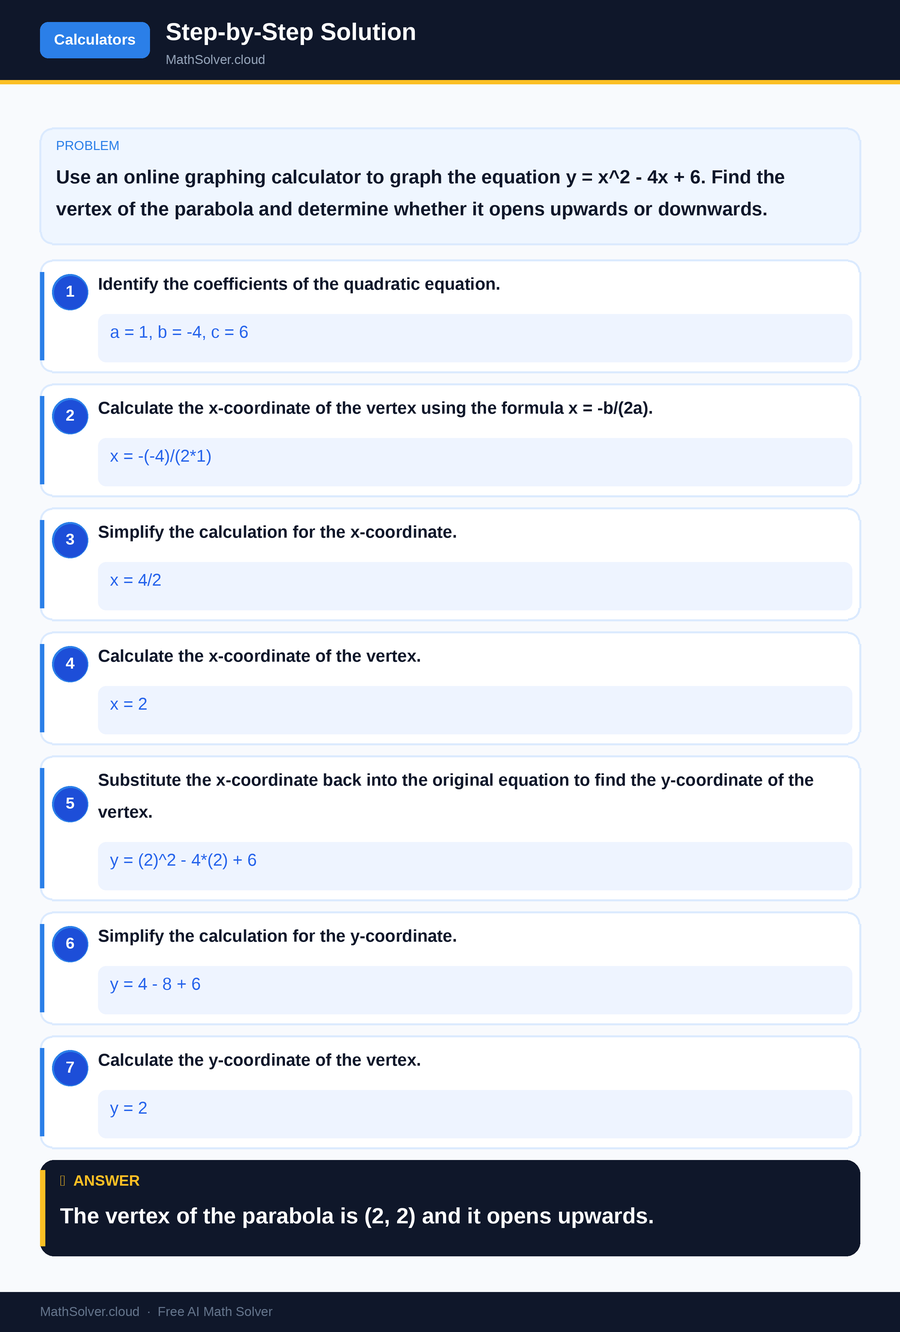
MathSolver Chrome extension solving this problem step-by-step
Common Mistakes to Avoid
One common mistake students make when using a math graphing calculator is inputting equations incorrectly. Even a small typo can lead to inaccurate graphs. Always double-check your entries for errors, especially when dealing with complex equations.
Another frequent error is neglecting to adjust the viewing window. An improperly set window can cause important features of the graph to be missed or distorted, leading to incorrect interpretations.
Additionally, students sometimes overlook the significance of analyzing the graph's features. Simply plotting a graph is not enough; interpreting the intercepts, slopes, and vertices is crucial for understanding the underlying mathematical concepts. Taking the time to thoroughly analyze these elements will greatly enhance your comprehension and application of the material.
Real-World Applications
Math graphing calculators are incredibly useful in various real-world scenarios. For instance, engineers use them to model and analyze systems, predicting behaviors and outcomes. This tool is also invaluable in the field of economics, where analysts use graphs to interpret market trends and forecast economic changes.
In education, math graphing calculators are essential for students studying advanced math subjects like calculus and algebra. They enable learners to visualize complex equations and explore mathematical concepts interactively. By using these calculators, students can gain a deeper understanding of mathematical relationships and improve their problem-solving skills.
Frequently Asked Questions
❓ What is a math graphing calculator used for?
❓ Why do students struggle with math graphing calculators?
❓ How can AI help with math graphing calculators?
❓ What are some alternatives to physical graphing calculators?
❓ How do I choose the right graphing calculator for my needs?
🚀 Solve any math problem instantly
2,000+ students use MathSolver every day — join them for free
📥 Add to Chrome — It's Free