Comprehensive Guide to the Linear Regression Equation
📋 In this guide
The linear regression equation is a powerful statistical tool used to model the relationship between two variables by fitting a linear equation to observed data. Many students often struggle with understanding this concept due to its mathematical nature and the intricacies involved in interpreting the results. However, mastering the linear regression equation is essential for anyone looking to analyze data or predict outcomes based on existing trends. In this comprehensive guide, you'll learn what exactly a linear regression equation is, how to find it, and how to apply it to real-world situations.
Linear regression is divided into two main types: simple linear regression and multiple linear regression. The simple linear regression equation deals with the relationship between two variables, typically an independent variable and a dependent variable. On the other hand, the multiple linear regression equation involves more than one independent variable affecting the dependent variable. This guide will primarily focus on the simple linear regression equation, as it forms the foundation for understanding more complex models.
By the end of this article, you'll not only understand the key components and steps involved in formulating a linear regression equation, but you'll also be able to apply this knowledge to solve practical problems. We will provide you with a step-by-step guide, detailed examples, and insights into common mistakes and real-world applications. Let's dive in to demystify the linear regression equation and equip you with the skills necessary to tackle any problem involving it.
Step-by-Step: How to Solve Linear Regression Equation
Step 1: Understanding the Data
Before you can derive a linear regression equation, it's crucial to understand the data you're working with. This involves identifying the dependent and independent variables. The dependent variable is the outcome you're interested in predicting or explaining, while the independent variable is the factor you believe is influencing the dependent variable. For example, in a study examining the impact of hours studied on test scores, test scores would be the dependent variable, and hours studied would be the independent variable.
Step 2: Calculating the Slope (m)
The slope 'm' is a key component of the linear regression equation as it indicates the direction and strength of the relationship between the variables. To calculate the slope, use the formula: m = (sum of (x_i - mean of x) * (y_i - mean of y)) / (sum of (x_i - mean of x)^2). This formula calculates the covariance of the variables divided by the variance of the independent variable, providing the best-fit slope for the data.
Step 3: Finding the Y-Intercept (b)
Once you have the slope, the next step is to find the y-intercept 'b'. This is the value of the dependent variable when the independent variable is zero. To calculate 'b', use the formula: b = mean of y - m * mean of x. This formula ensures that the line best fits the data by minimizing the distance between the observed values and the predicted values from the linear regression equation.
Step 4: Formulating the Linear Regression Equation
With both the slope 'm' and the intercept 'b' calculated, you can now formulate the linear regression equation: y = mx + b. This equation can be used to predict the value of the dependent variable 'y' for any given value of the independent variable 'x'. Understanding this equation allows you to make predictions and insights based on the data, forming the basis for more complex analyses, such as those involving multiple linear regression equations.
🤖 Stuck on a math problem?
Take a screenshot and let our AI solve it step-by-step in seconds
⚡ Try MathSolver Free →Worked Examples
Example 1
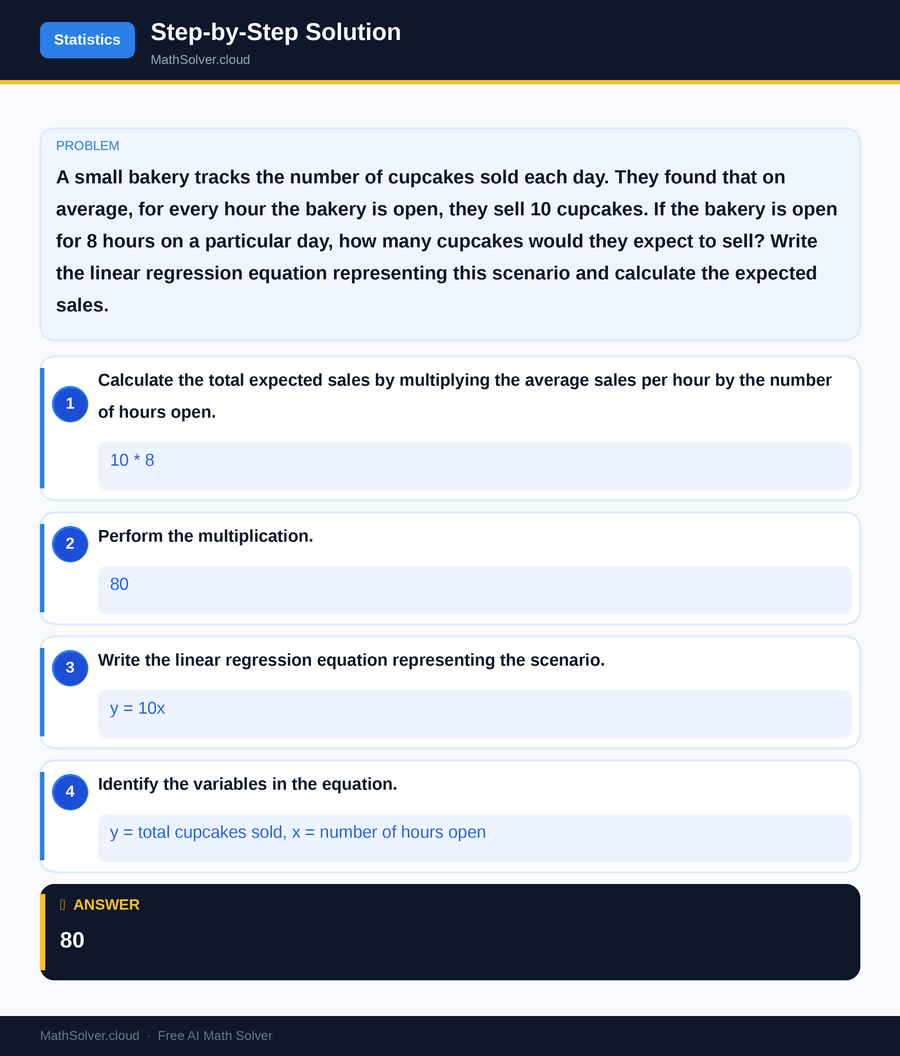
MathSolver Chrome extension solving this problem step-by-step
Example 2
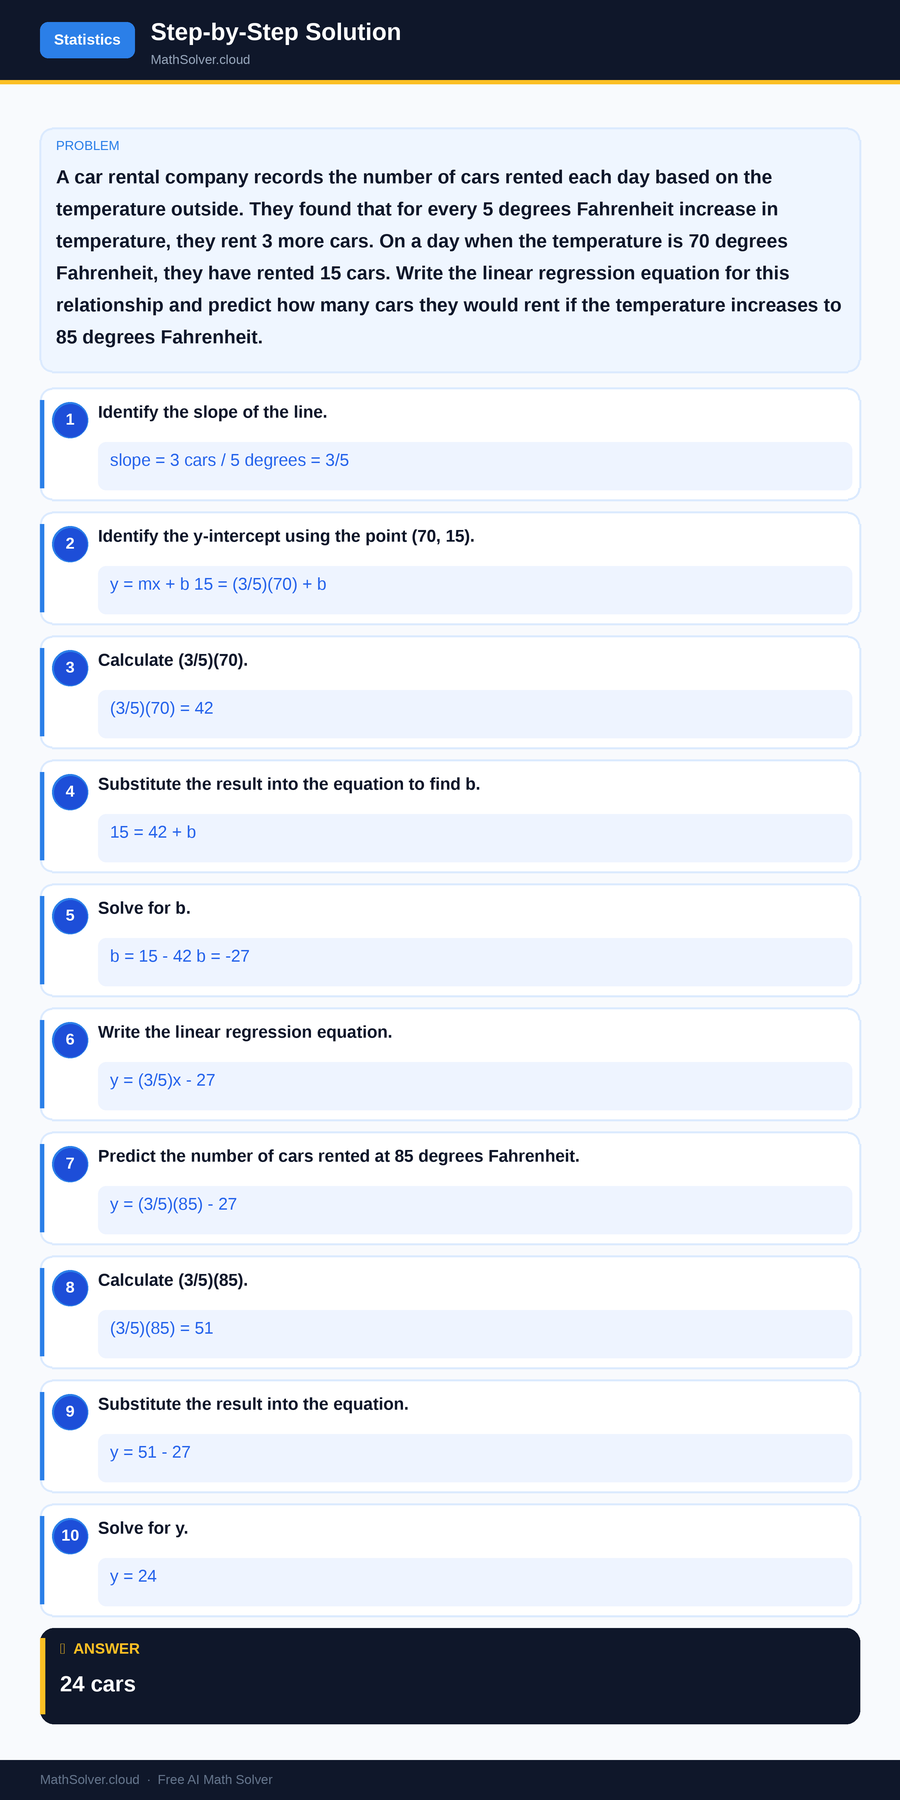
MathSolver Chrome extension solving this problem step-by-step
Common Mistakes to Avoid
One common mistake students make is using the wrong variables as dependent and independent, leading to incorrect interpretations. Always ensure the variable you aim to predict is assigned as the dependent variable. Another frequent error is miscalculating the slope and intercept by not centering the data correctly around the mean, which can skew your results. Double-check calculations and ensure all data is accurately recorded and interpreted.
Additionally, students often overlook the importance of checking model assumptions, such as linearity, homoscedasticity, and normality of residuals. Failing to validate these assumptions can lead to unreliable predictions. Always analyze residual plots and other diagnostic tools to confirm the appropriateness of your linear regression model.
Real-World Applications
The linear regression equation is widely used in various fields, from economics to biology, providing insights into trends and making predictions. In economics, it helps in forecasting financial trends, such as predicting future stock prices or sales volume based on historical data. For instance, a business analyst might use linear regression to understand the relationship between advertising spend and sales revenue.
In the healthcare field, linear regression can be used to predict patient outcomes based on treatment variables, enhancing the quality of care. For example, researchers might analyze the relationship between drug dosage and patient recovery rates. These applications demonstrate the versatility and power of the linear regression equation in solving real-world problems.
Frequently Asked Questions
❓ What is a linear regression equation?
❓ How do I know which regression equation best fits the data?
❓ How can AI help with linear regression equations?
❓ What is the difference between simple and multiple linear regression equations?
❓ How can I find the linear regression equation using a calculator?
🚀 Solve any math problem instantly
2,000+ students use MathSolver every day — join them for free
📥 Add to Chrome — It's Free