Mastering the Equation of the Regression
📋 In this guide
The equation of the regression is a crucial concept in statistics that helps us understand the relationship between two variables. This statistical tool allows us to make predictions and analyze trends based on data sets, which can be incredibly valuable in various fields such as economics, biology, and social sciences. Many students find the equation of the regression challenging because it involves several mathematical steps and requires a good grasp of algebraic concepts. Throughout this article, you'll learn what the equation of the regression is, how to calculate it, and how to apply it to real-life data sets.
Understanding the equation of the regression is essential for anyone dealing with data analysis, as it provides a method to quantify and predict relationships between variables. Students often struggle with this topic because it involves multiple calculations, including finding means, sums, and working with fractions. However, once you grasp the underlying principles and practice with a few examples, the process becomes much more manageable.
In this comprehensive guide, we will break down the steps to find the equation of the regression line, provide detailed worked examples, and discuss common mistakes to avoid. By the end of this article, you will be equipped with the knowledge and confidence to tackle regression problems effectively and understand their applications in various real-world scenarios.
Step-by-Step: How to Solve Equation Of The Regression
Step 1: Collect and Organize Your Data
Before you can find the equation of the regression line, you need to collect and organize your data. Typically, data is presented as pairs of values, where one value is the independent variable and the other is the dependent variable. Arrange these pairs in a table format for clarity. For instance, if you are examining the relationship between hours studied and test scores, your data might look like this: (2, 75), (3, 80), (4, 85), etc. Ensure that all data is accurate and complete to avoid errors in your calculations.
Step 2: Calculate the Necessary Sums
Next, calculate the sums required for the formula. This includes the sum of all x-values, the sum of all y-values, the sum of the product of x and y for each pair, and the sum of the squares of the x-values. These sums are critical for finding the slope 'm' and the y-intercept 'b' of the regression line. For example, if your data points are (x1, y1), (x2, y2), ..., (xn, yn), compute the sum of x, sum of y, sum of xy, and sum of x^2.
Step 3: Calculate the Slope (m)
Now, use the sums calculated in the previous step to find the slope 'm' of the regression line. The formula is m = [n(sum of xy) - (sum of x)(sum of y)] / [n(sum of x^2) - (sum of x)^2], where 'n' is the number of data points. Carefully substitute the values into the formula and perform the calculations step by step. The slope indicates the rate of change of the dependent variable with respect to the independent variable.
Step 4: Determine the Y-Intercept (b)
Finally, calculate the y-intercept 'b' using the formula b = (sum of y - m(sum of x)) / n. This step involves substituting the previously calculated slope 'm' and the sums into the formula. The y-intercept represents the value of 'y' when 'x' is zero. With both 'm' and 'b' calculated, you can now write the complete equation of the regression line as y = mx + b.
🤖 Stuck on a math problem?
Take a screenshot and let our AI solve it step-by-step in seconds
⚡ Try MathSolver Free →Worked Examples
Example 1
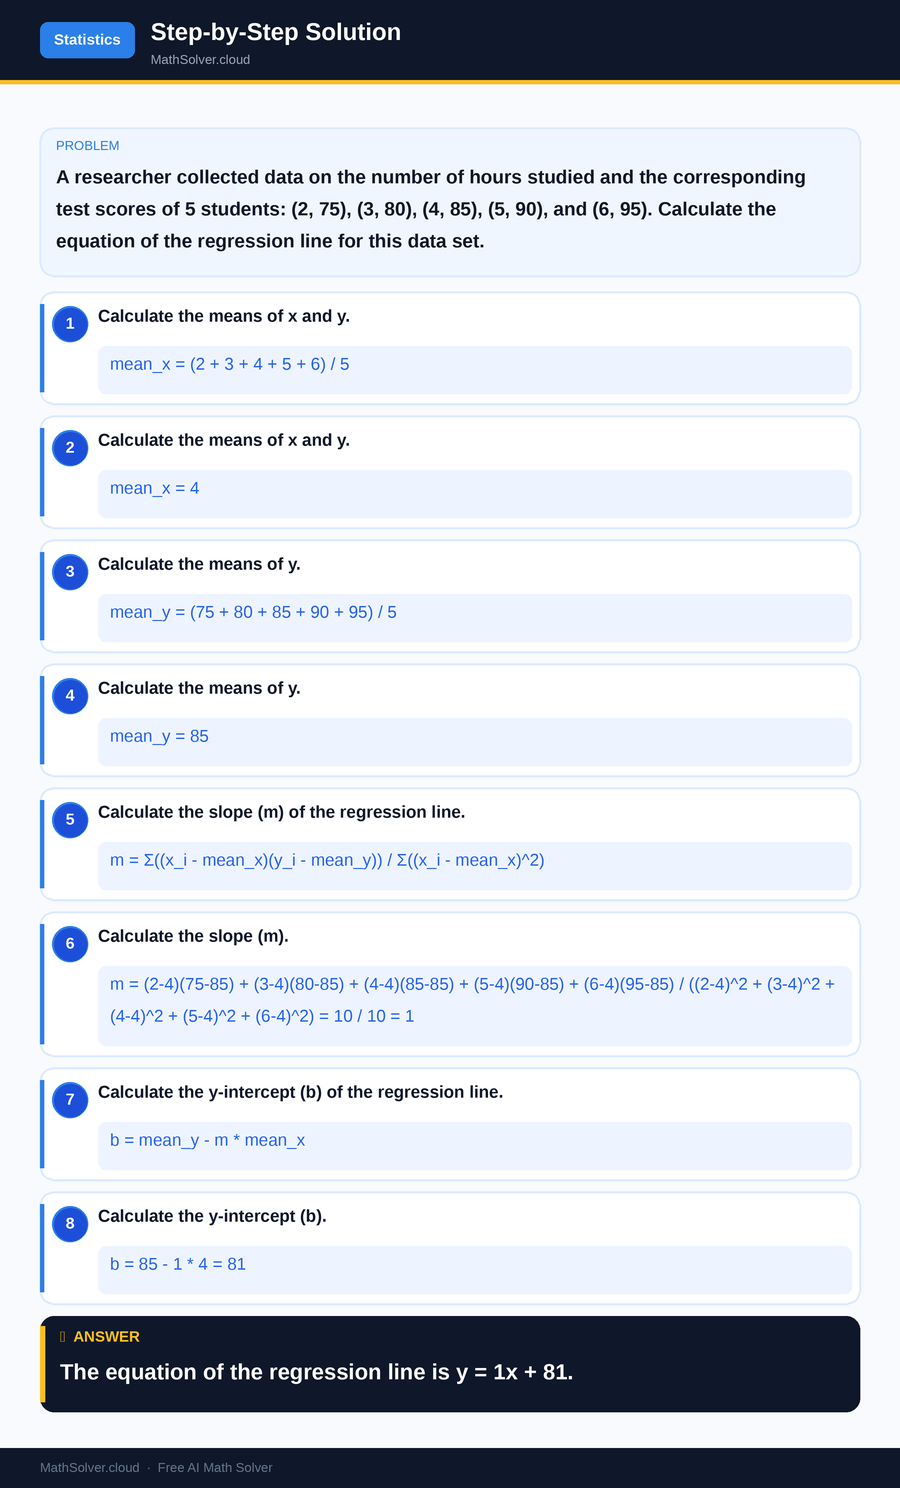
MathSolver Chrome extension solving this problem step-by-step
Example 2
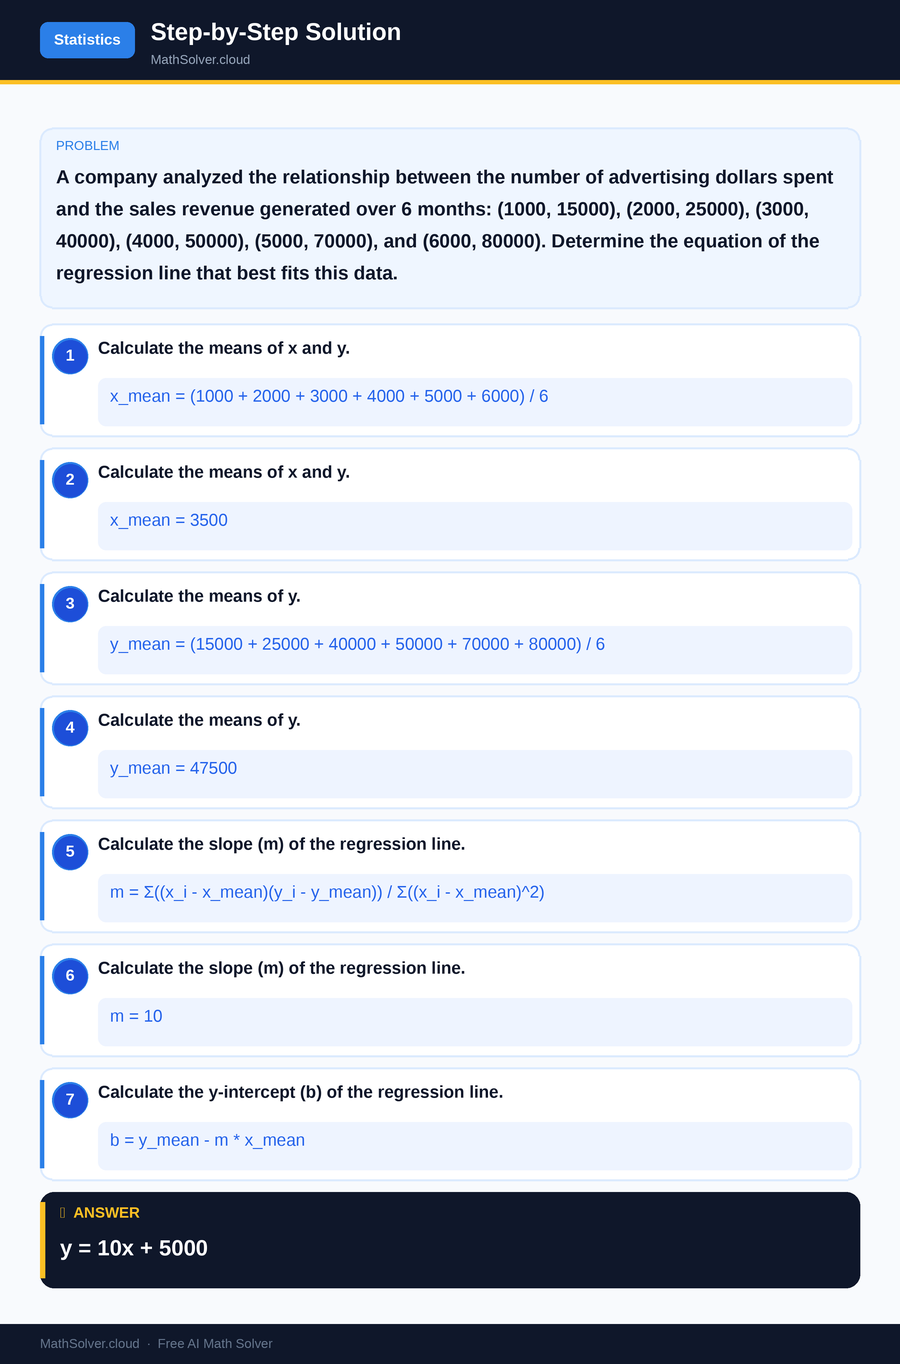
MathSolver Chrome extension solving this problem step-by-step
Common Mistakes to Avoid
One common mistake when finding the equation of the regression line is miscalculating the sums or misapplying the formulas, which can lead to incorrect results. To avoid this, double-check each calculation and ensure that all numerical values are substituted correctly into the formulas. Another error is failing to distinguish between the independent and dependent variables, leading to a swapped regression line. Always clearly identify which variable is 'x' and which is 'y' at the start of your analysis.
Additionally, students often overlook the importance of data accuracy. Any errors or omissions in the data set can significantly impact the final equation. It's crucial to verify the data before proceeding with calculations. By being meticulous and methodical in your approach, you can avoid these common pitfalls and arrive at the correct regression equation.
Real-World Applications
The equation of the regression is widely used in various real-world applications. In business, it helps companies predict future sales based on advertising expenditure or market trends. For example, a company can use regression analysis to determine the potential increase in sales revenue from investing extra dollars in advertising.
In the field of medicine, regression analysis is used to study the relationship between risk factors and health outcomes. Researchers can analyze how lifestyle choices like diet and exercise influence health metrics such as blood pressure or cholesterol levels. These applications demonstrate the versatility and importance of the equation of the regression in making informed decisions across different industries.
Frequently Asked Questions
❓ What is the equation of the regression line?
❓ How do you find the equation of the regression line?
❓ How can AI help with equation of the regression?
❓ Which regression equation best fits the data?
❓ How is the equation of the regression used in statistics?
🚀 Solve any math problem instantly
2,000+ students use MathSolver every day — join them for free
📥 Add to Chrome — It's Free