Understanding the Equation for Variance
📋 In this guide
The equation for variance is a fundamental concept in statistics that helps us understand how data points in a dataset are spread out. It is crucial for students to grasp this concept because variance provides insights into the reliability and variability of data. Despite its importance, many students struggle with calculating variance because it involves multiple algebra equations and can be conceptually challenging. In this article, we will break down the equation for variance into manageable steps, providing you with a clear understanding and practical examples. By the end of this guide, you'll confidently tackle problems involving variance, whether they appear in your statistics homework or in analyzing real-world data.
Variance is not just a standalone concept; it also plays a crucial role in understanding and calculating the standard deviation, which is the square root of the variance. Mastering the equation for variance and standard deviation is essential for anyone looking to excel in statistics or any field that requires data analysis. This guide will walk you through the formula, step-by-step calculations, and common mistakes to avoid, ensuring that you have a solid foundation in these statistical concepts.
Additionally, we will explore real-world applications of variance, such as in business and science, to showcase its practical value. Whether you're a student grappling with homework problems or a professional aiming to interpret data accurately, understanding the equation for variance is a skill worth mastering. So, let's dive into the details and demystify this vital statistical tool.
Step-by-Step: How to Solve Equation For Variance
Step 1: Calculate the Mean
To begin calculating the variance, the first step is to find the mean (average) of your dataset. Add up all the data points and then divide by the number of data points. For example, if you have five scores: 80, 85, 90, 75, and 95, you would add these numbers together to get a sum of 425. Then, divide this sum by 5, which is the number of scores, to get a mean of 85. This mean will be used in the subsequent steps to determine how each data point deviates from the average.
Step 2: Find the Deviations
Once you have the mean, the next step is to find the deviation of each data point from the mean. This involves subtracting the mean from each individual data point to see how far each one is from the average. Continuing with our example, subtract 85 from each score: (80-85), (85-85), (90-85), (75-85), and (95-85). This will give you deviations of -5, 0, 5, -10, and 10, respectively. These deviations are critical as they show the spread of the data points around the mean.
Step 3: Square the Deviations
The third step is to square each of these deviations. Squaring has the effect of eliminating negative values and emphasizing larger deviations, providing a clearer picture of data variability. In our example, squaring the deviations will result in: 25, 0, 25, 100, and 100. These squared deviations are the foundation of the variance as they show how much the data points deviate from the mean in a squared unit form.
Step 4: Calculate the Variance
The final step is to calculate the variance by averaging the squared deviations. For a population variance, sum all the squared deviations and divide by the total number of data points. In our example, sum the squared deviations (25 + 0 + 25 + 100 + 100 = 250) and then divide by 5 (the number of data points), resulting in a variance of 50. If you are calculating the sample variance, remember to divide by N-1 instead of N. This variance value represents the average squared deviation from the mean and provides insight into the data's spread.
🤖 Stuck on a math problem?
Take a screenshot and let our AI solve it step-by-step in seconds
⚡ Try MathSolver Free →Worked Examples
Example 1
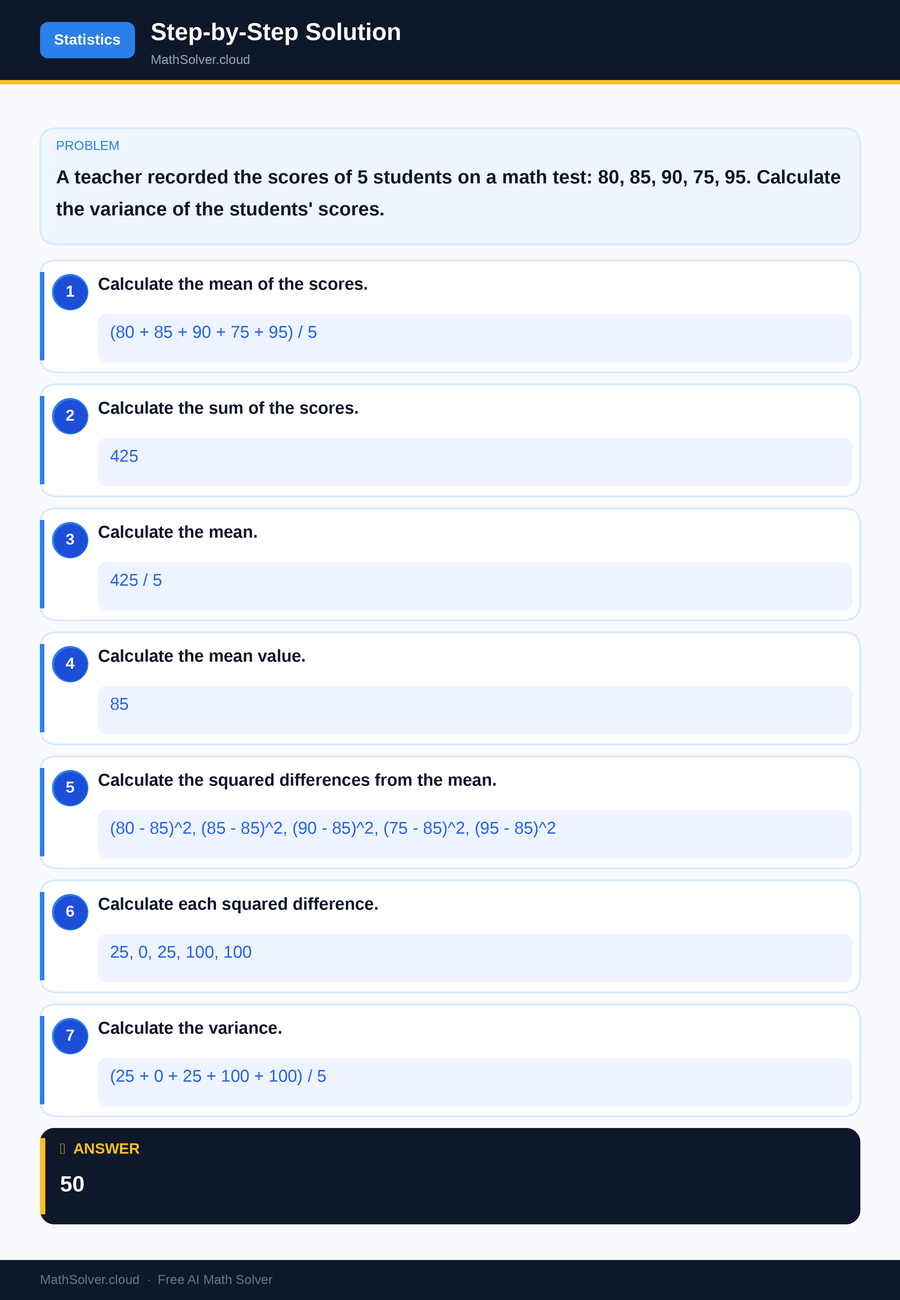
MathSolver Chrome extension solving this problem step-by-step
Example 2
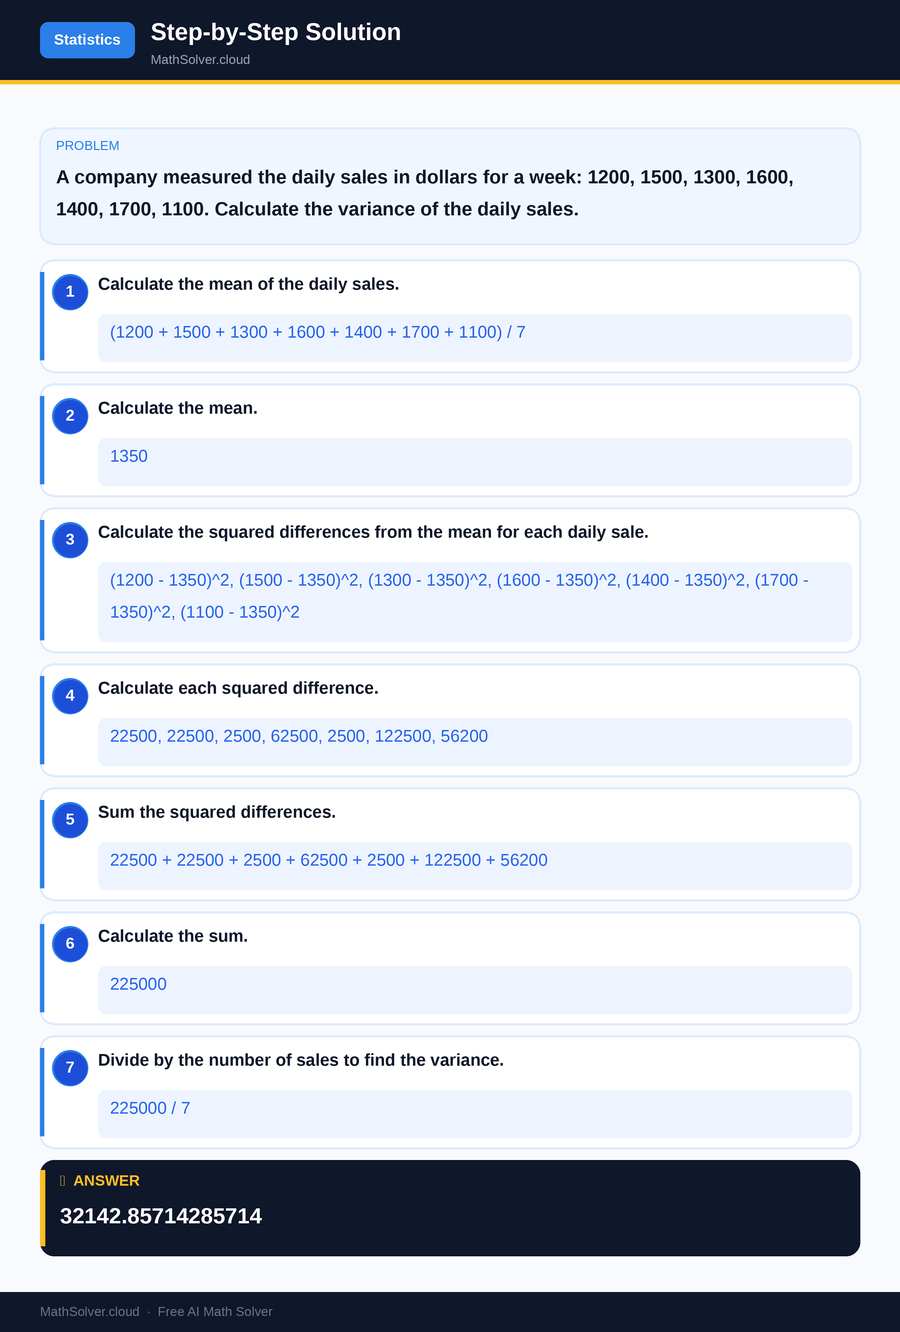
MathSolver Chrome extension solving this problem step-by-step
Common Mistakes to Avoid
One common mistake when calculating variance is forgetting to square the deviations. This step is crucial because it eliminates negative values and accurately represents the spread of the data. Another error is using the wrong denominator; for a sample variance, you must divide by N-1, not N. This accounts for the degrees of freedom and provides a more accurate estimate of variance when working with a sample of a larger population.
Additionally, students sometimes mix up variance with standard deviation. Remember, variance is the average of the squared deviations, while standard deviation is the square root of the variance. Keeping these definitions clear will help you avoid confusion and ensure accurate calculations.
Real-World Applications
Variance is widely used in finance to assess risk. Investors analyze the variance of stock returns to understand how much a stock's price might fluctuate, helping them make informed decisions. For example, a stock with a high variance indicates a volatile investment, while a low variance suggests stability.
In manufacturing, variance helps monitor quality control. Companies use variance to track product dimensions or weights, ensuring they stay within acceptable limits. This application is critical in maintaining product consistency and customer satisfaction.
Frequently Asked Questions
❓ What is the equation for variance?
❓ Why is variance important in statistics?
❓ How can AI help with the equation for variance?
❓ What is the difference between variance and standard deviation?
❓ How is variance used in data analysis?
🚀 Solve any math problem instantly
2,000+ students use MathSolver every day — join them for free
📥 Add to Chrome — It's Free