Exploring the Equation for the Standard Deviation
📋 In this guide
The equation for the standard deviation is a fundamental concept in statistics that measures the amount of variation or dispersion in a set of data values. Many students find it challenging to grasp due to its mathematical complexity and the abstract nature of statistical concepts. Understanding this equation is crucial, as it provides insights into the data's consistency and reliability. In this article, we will explore the equation for the standard deviation, breaking it down into manageable steps to ensure clarity and comprehension.
Students often struggle with the equation for the standard deviation because it involves multiple steps, including calculating the mean, finding deviations, squaring those deviations, and then finding the square root of the average of these squared deviations. However, by dissecting each part of the process and practicing with examples, students can develop a stronger grasp of this essential statistical measure. This article aims to demystify the equation for the standard deviation and guide you through its calculation with ease.
Throughout this guide, we will explore the standard deviation's relevance in various fields, its mathematical foundation, and practical application. By the end, you'll not only understand how to calculate the standard deviation but also appreciate its significance in analyzing data. Whether you're tackling algebra equations or seeking to understand kinematic equations in physics, mastering the equation for the standard deviation will enhance your analytical skills and boost your confidence in handling statistical data.
Step-by-Step: How to Solve Equation For The Standard Deviation
Step 1: Calculate the Mean
The first step in solving the equation for the standard deviation is calculating the mean of the data set. The mean is the average of all the data points and serves as a reference point for measuring variation. To find the mean, add up all the data points and divide the sum by the total number of data points. This step is crucial because the mean will be used to determine how far each data point deviates from the average.
Step 2: Find the Deviations
After calculating the mean, the next step is to determine the deviation of each data point from the mean. This involves subtracting the mean from each data point. The deviation indicates how much each data point differs from the average value. These deviations are essential for understanding the spread of the data set and are used in the subsequent steps to calculate the standard deviation.
Step 3: Square the Deviations
Once you have calculated the deviations, the third step is to square each of these deviations. Squaring the deviations ensures that all values are positive, which is necessary for accurately calculating the dispersion of the data set. This step eliminates the issue of positive and negative deviations canceling each other out, providing a clearer picture of the data's variability.
Step 4: Calculate the Standard Deviation
The final step in solving the equation for the standard deviation is to compute the average of the squared deviations and then take the square root of this average. First, sum up all the squared deviations and divide by the number of data points (N) to find the variance. Then, take the square root of the variance to obtain the standard deviation. This value represents the average distance of each data point from the mean, providing a comprehensive measure of the data set's dispersion.
🤖 Stuck on a math problem?
Take a screenshot and let our AI solve it step-by-step in seconds
⚡ Try MathSolver Free →Worked Examples
Example 1
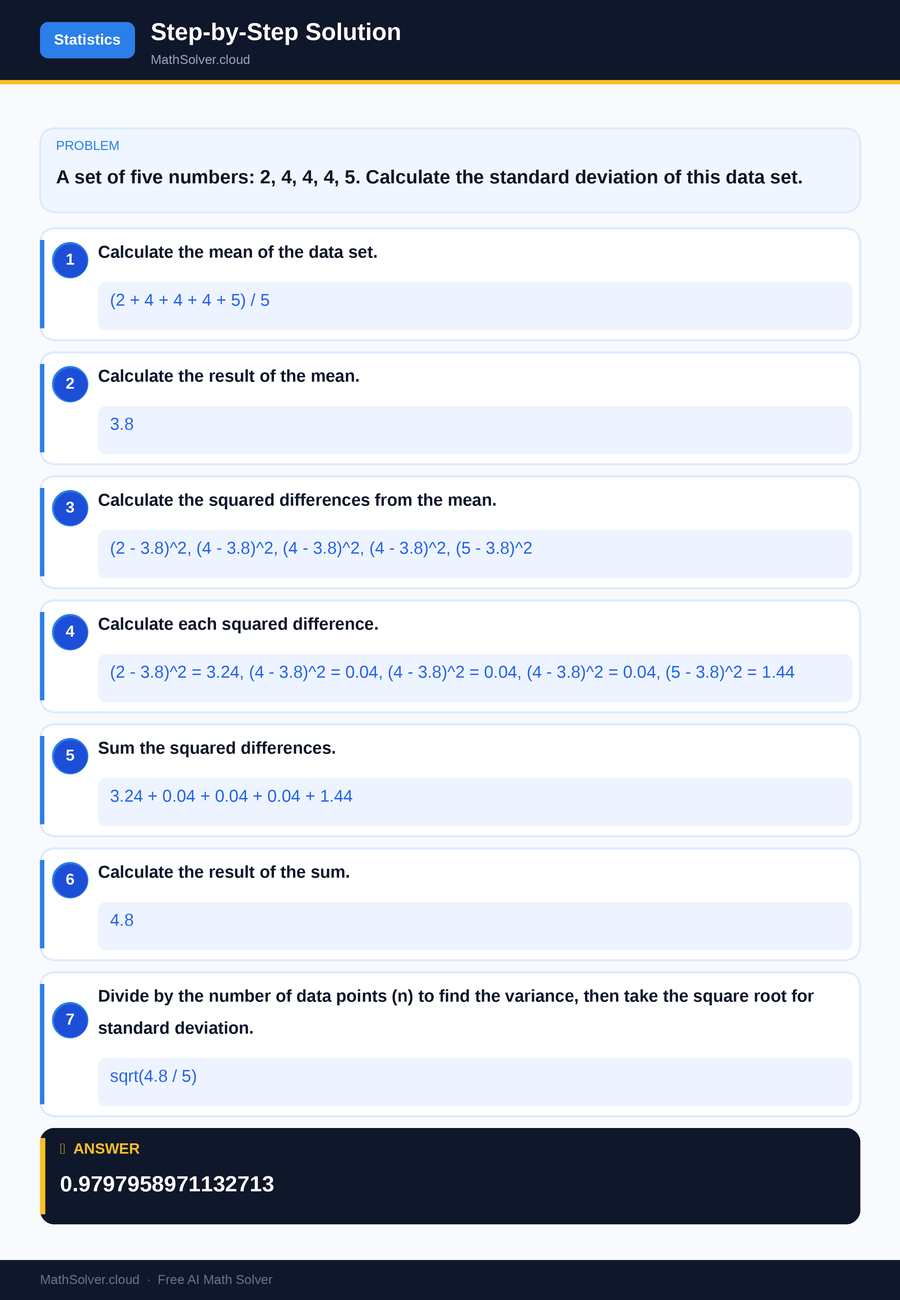
MathSolver Chrome extension solving this problem step-by-step
Example 2
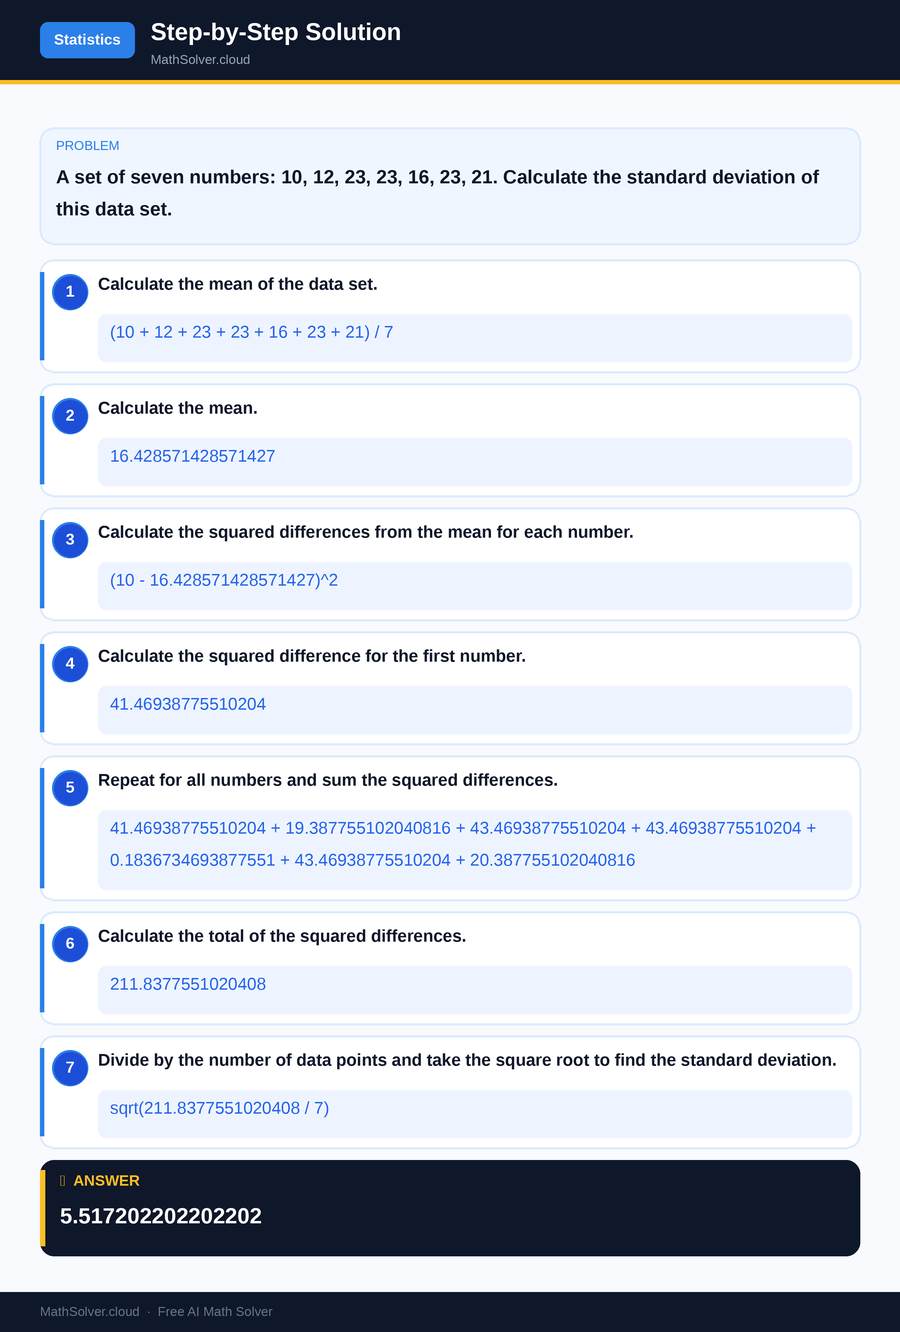
MathSolver Chrome extension solving this problem step-by-step
Common Mistakes to Avoid
One common mistake students make when working with the equation for the standard deviation is forgetting to square the deviations before averaging them. This step is crucial because it ensures that all deviations are positive, which accurately reflects the data's variability. Skipping this step can lead to incorrect results and a misunderstanding of the data set's spread.
Another frequent error is using the wrong denominator when calculating the variance. Students often divide by the number of data points minus one (N - 1) instead of the total number of data points (N), especially when working with sample data. This distinction is important, as it affects the final result. To avoid this error, ensure you understand whether you're working with a population or a sample and use the appropriate formula.
Real-World Applications
The equation for the standard deviation is widely used in various fields to assess data variability and reliability. In finance, for instance, standard deviation is used to gauge investment risk. A higher standard deviation indicates a higher risk, as the investment's returns are more volatile. This information is crucial for investors when making decisions about their portfolios.
In quality control, manufacturers use the standard deviation to monitor product consistency. By assessing the variation in product dimensions or performance, companies can maintain quality standards and reduce defects. Understanding the standard deviation helps businesses identify areas for improvement and ensure customer satisfaction.
Frequently Asked Questions
❓ What is the equation for the standard deviation used for?
❓ Why is it important to understand the equation for the standard deviation?
❓ How can AI help with the equation for the standard deviation?
❓ How does the standard deviation relate to other statistical measures like variance?
❓ Can the standard deviation be used to determine which regression equation best fits the data?
🚀 Solve any math problem instantly
2,000+ students use MathSolver every day — join them for free
📥 Add to Chrome — It's Free