Mastering the Equation for Standard Deviation
📋 In this guide
The equation for standard deviation is a fundamental concept in statistics that measures the amount of variation or dispersion in a set of data values. Students often struggle with understanding this equation because it involves several steps and requires a clear grasp of statistical concepts. However, mastering the equation for standard deviation is crucial for anyone looking to deepen their understanding of data analysis. In this article, you'll learn not just what the equation for standard deviation is, but also how to apply it step by step in various scenarios. By the end, you will be more confident in calculating standard deviation and understanding its significance in statistics.
Students often find the equation for standard deviation daunting because it is more complex than other algebra equations they encounter. It involves calculating the mean of data, determining deviations from the mean, squaring these deviations, and then taking an average. This multi-step process is akin to solving a quadratic equation or even navigating the intricacies of kinematic equations in physics. But fear not; this guide will help you break down each step into manageable parts, ensuring you fully grasp each stage of the calculation.
As we delve into the world of standard deviation, you'll also learn about common mistakes to avoid and discover the real-world applications of this statistical measure. Whether you're tackling mystatlab homework answers in statistics or trying to determine which regression equation best fits the data, understanding the equation for standard deviation will be invaluable. So, let's dive in and explore this essential statistical tool.
Step-by-Step: How to Solve Equation For Standard Deviation
Step 1: Calculate the Mean
The first step in using the equation for standard deviation is to calculate the mean (average) of the data set. Add up all the data values and divide by the number of values in the set. This mean will serve as your reference point for calculating deviations. For example, in a data set with values 4, 8, 6, 5, and 3, the mean would be (4 + 8 + 6 + 5 + 3) / 5 = 26 / 5 = 5.2.
Step 2: Determine Deviations from the Mean
Next, calculate how far each data point deviates from the mean by subtracting the mean from each value. This step is crucial because it indicates how spread out the data points are around the mean. Using the same data set, the deviations would be 4 - 5.2, 8 - 5.2, 6 - 5.2, 5 - 5.2, and 3 - 5.2, resulting in deviations of -1.2, 2.8, 0.8, -0.2, and -2.2 respectively.
Step 3: Square the Deviations
Once the deviations are calculated, square each of these differences to eliminate negative values and emphasize larger deviations. Squaring ensures that the standard deviation reflects the extent of variability in the data. For our data set, the squared deviations would be (-1.2)^2, (2.8)^2, (0.8)^2, (-0.2)^2, and (-2.2)^2, resulting in 1.44, 7.84, 0.64, 0.04, and 4.84.
Step 4: Calculate the Variance and Standard Deviation
Finally, to complete the equation for standard deviation, find the average of these squared deviations (variance) and then take the square root. For the sample data set, the variance is (1.44 + 7.84 + 0.64 + 0.04 + 4.84) / 5 = 2.96. The standard deviation is then the square root of 2.96, which is approximately 1.72.
🤖 Stuck on a math problem?
Take a screenshot and let our AI solve it step-by-step in seconds
⚡ Try MathSolver Free →Worked Examples
Example 1
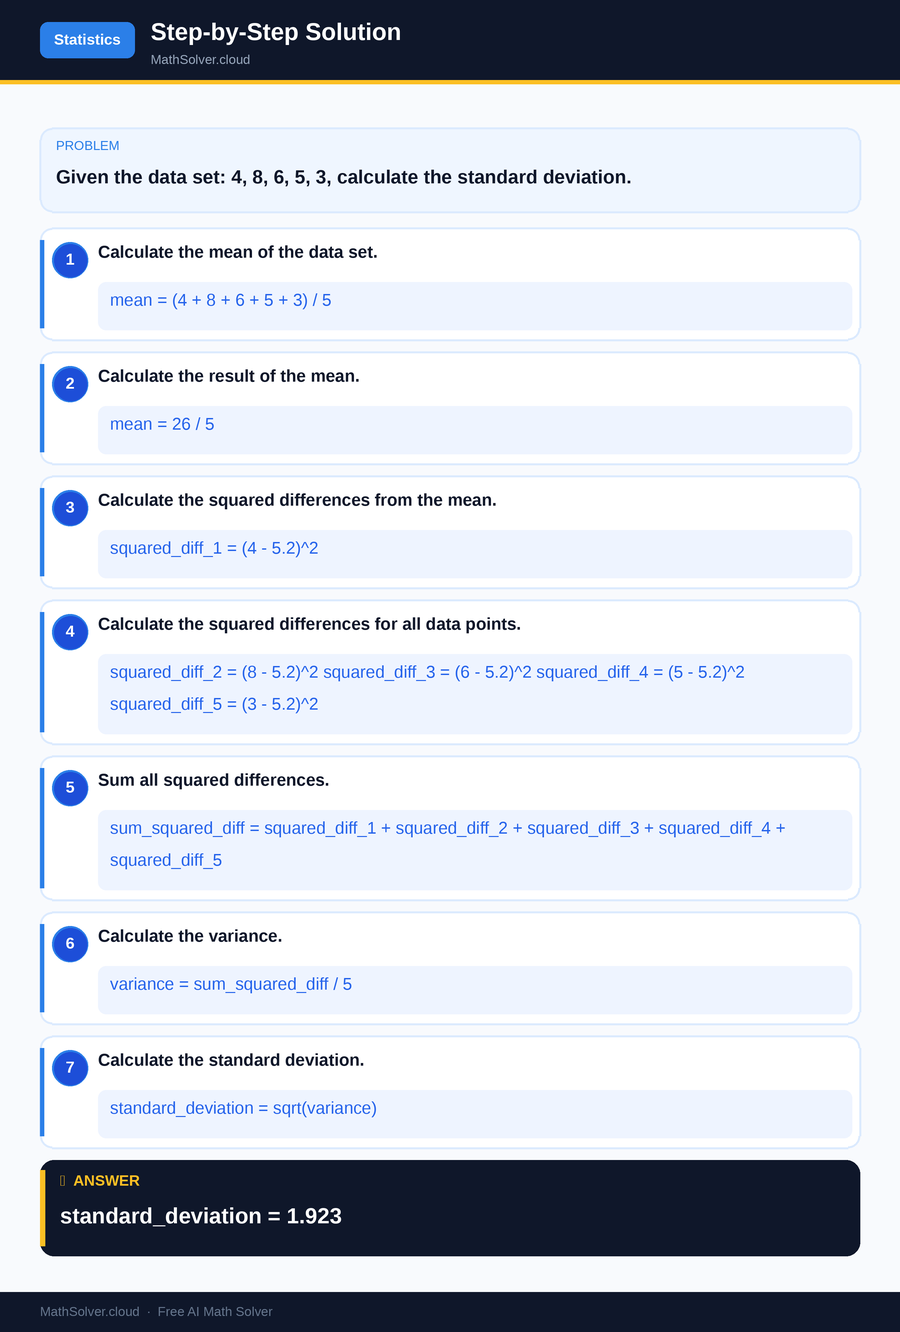
MathSolver Chrome extension solving this problem step-by-step
Example 2
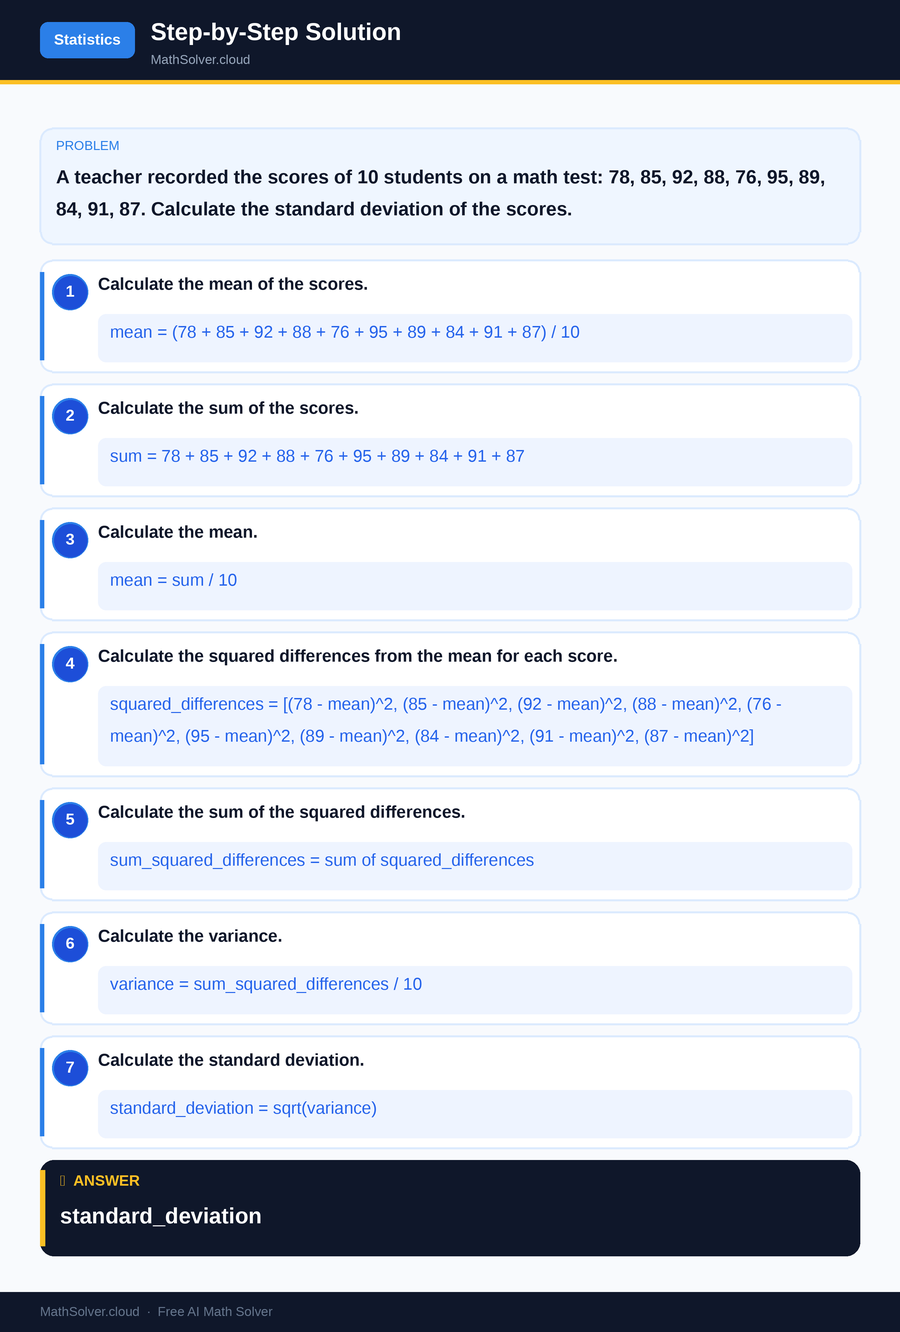
MathSolver Chrome extension solving this problem step-by-step
Common Mistakes to Avoid
One common mistake students make when using the equation for standard deviation is forgetting to square the deviations. This step is crucial because it removes any negative signs and emphasizes larger deviations. Another frequent error is incorrectly calculating the mean, which can throw off all subsequent calculations. Double-check your arithmetic at each step to prevent these mistakes.
Another error is confusion between population and sample standard deviation. The formula slightly differs for a sample, where the variance divisor is N-1 instead of N. This correction (known as Bessel's correction) accounts for the fact that a sample is just an estimate of the whole population. Make sure to use the correct formula for your specific context.
Real-World Applications
The equation for standard deviation is widely used in various fields to measure data variability. In finance, it is used to assess investment risks; a higher standard deviation indicates a higher risk. Similarly, in quality control, companies use standard deviation to ensure product consistency and quality by analyzing the variability in production processes.
In the field of education, teachers use standard deviation to understand students' performance variability in exams. This helps in identifying students who may need extra help or in recognizing exceptionally high or low performers. Understanding standard deviation can also aid in interpreting test results, such as standardized tests, where it's crucial to know how scores spread around the mean to make informed decisions.
Frequently Asked Questions
❓ What is the equation for standard deviation?
❓ Why is standard deviation important in statistics?
❓ How can AI help with the equation for standard deviation?
❓ What is the difference between variance and standard deviation?
❓ How is standard deviation used in real-world scenarios?
🚀 Solve any math problem instantly
2,000+ students use MathSolver every day — join them for free
📥 Add to Chrome — It's Free